
3.2 Strategy: Cross-Platform Arbitrage
Key Takeaways
- Cross-platform arbitrage — buying on one platform and selling on another — is the purest form of structural edge, but profitable opportunities are rarer and smaller than most people think
- After accounting for spreads, fees, slippage, and capital lock, most “obvious” arbitrage opportunities yield less than 2% net — and many are actually unprofitable
- Successful arbitrage requires pre-funded accounts on multiple platforms, fast execution, and a systematic approach to identifying opportunities that exceed your Total Friction Threshold
- The Go/No-Go Checklist in this module is your decision framework — memorize it before attempting any arbitrage trade
- Arbitrage is not a beginner strategy despite sounding “risk-free” — it requires significant capital, multi-platform access, and careful execution
Scope: This module teaches you to identify, evaluate, and execute cross-platform arbitrage in prediction markets. It applies the structural edge framework from Module 3.1 and the friction analysis from Module 2.3. It does not cover intra-platform arbitrage between correlated markets (that’s part of Module 4.3: Portfolio Construction).
What Is Cross-Platform Arbitrage?
Arbitrage is buying and selling the same asset at different prices to lock in a risk-free profit. In prediction markets, this means:
- You find the same event priced differently on two platforms
- You buy the cheaper contract on Platform A
- You sell the equivalent contract on Platform B
- Regardless of the outcome, you profit from the price difference
The textbook example:
- Polymarket: “Will X happen?” — Yes at $0.40
- Kalshi: “Will X happen?” — Yes at $0.48
If you buy Yes at $0.40 on Polymarket and sell Yes at $0.48 on Kalshi, you’ve locked in $0.08 per contract. If the event happens, you win $1.00 on Polymarket (profit: $0.60) and lose $0.52 on Kalshi (you sold at $0.48, pay $1.00 – $0.48 = $0.52). Net: $0.60 – $0.52 = $0.08 profit. If the event doesn’t happen, both sides expire worthless: you lose $0.40 on Polymarket and gain $0.48 on Kalshi. Net: $0.48 – $0.40 = $0.08 profit.
Same profit regardless of outcome. That’s arbitrage.
Why It Sounds Too Good to Be True
Because it mostly is. The textbook version omits the four things that kill most arbitrage in practice.
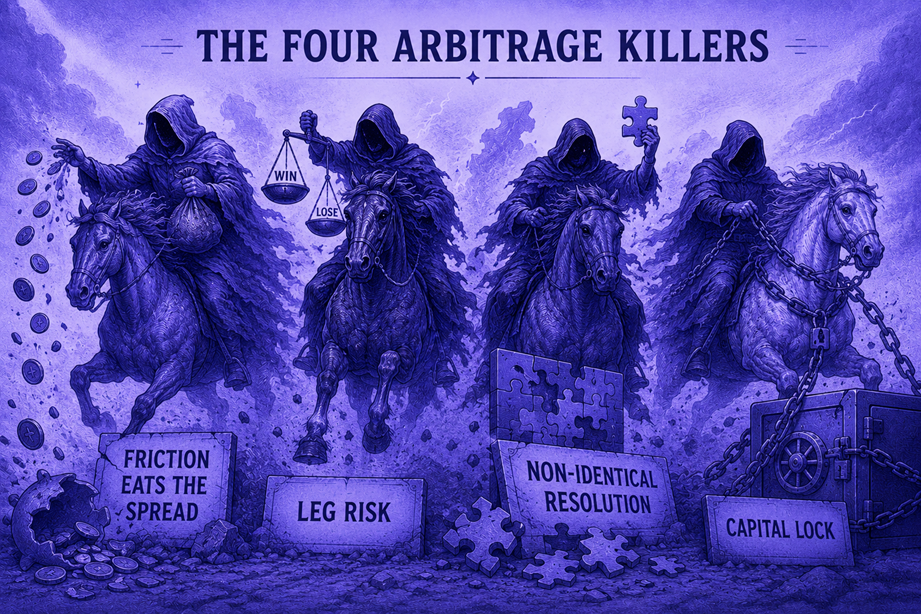
The Four Arbitrage Killers
Killer 1: Friction Eats the Spread
We covered this in Module 2.3, but it bears repeating with arbitrage-specific numbers.
The $0.08 spread from our example, after friction:
| Cost Component | Platform A (Polymarket) | Platform B (Kalshi) | Total |
|---|---|---|---|
| Bid-ask spread to execute | $0.01 | $0.02 | $0.03 |
| Platform fee | $0.00 | ~$0.015 | $0.015 |
| Slippage (100 contracts) | $0.005 | $0.005 | $0.01 |
| Total friction | $0.055 |
Net profit after friction: $0.08 – $0.055 = $0.025 per contract
Your “risk-free $0.08” became $0.025. And this assumes:
- Both legs fill simultaneously (they won’t — see Killer 2)
- You already have capital on both platforms (no transfer costs)
- Resolution criteria are identical (they might not be — see Killer 3)
Killer 2: Leg Risk
“Leg risk” is the risk that one side of your arbitrage fills but the other doesn’t — or fills at a different price.
Scenario: You place your buy on Polymarket at $0.40. It fills. You immediately go to Kalshi to sell at $0.48. In the 30 seconds it took you to switch platforms, the Kalshi price moved to $0.44.
Now your spread is $0.04 instead of $0.08 — and after friction, you might be at breakeven or worse.
Solutions to leg risk:
- Pre-place limit orders on both platforms before either fills, accepting that both might not execute
- Use API execution to submit both orders programmatically within milliseconds
- Accept wider target spreads — only pursue arbitrage when the spread is large enough to survive a 2–3 cent price movement on either leg
Killer 3: Non-Identical Resolution
This is the subtlest and most dangerous killer. Two platforms asking “the same question” may have different resolution criteria:
- Kalshi: “Will U.S. GDP growth for Q2 2026 exceed 2.5% as reported in the BLS advance estimate?”
- Polymarket: “Will U.S. GDP growth for Q2 2026 exceed 2.5%?”
If the advance estimate says 2.4% but the revised estimate (published months later) says 2.6%, these markets could resolve differently. What you thought was risk-free arbitrage becomes a directional bet on whether the advance estimate will be revised.
Always read the full resolution criteria on both platforms before executing any arbitrage. If they’re not functionally identical, it’s not true arbitrage — it’s a correlated bet with divergent resolution risk.
Killer 4: Capital Lock
Arbitrage ties up capital on two platforms simultaneously for the full duration of the market.
Example: You arb 1,000 contracts with $0.025 net profit per contract = $25 total profit. Your capital commitment: $400 on Polymarket + $520 on Kalshi = $920 locked.
If the market resolves in 30 days, your return is $25 / $920 = 2.7% over 30 days = ~33% annualized.
That sounds great — until you consider that $920 in Treasury bills would earn $3.45 risk-free over the same period. Your incremental return from the arbitrage (above risk-free) is $25 – $3.45 = $21.55 on $920 of capital for 30 days.
Still profitable. But the point is: arbitrage requires significant capital to generate meaningful dollar returns. $25 on a $920 position isn’t going to change your life.
The Go/No-Go Checklist
Before executing any arbitrage, run through this checklist. Every item must be “Go” or you should walk away.
✅ 1. Spread Size vs. TFT
Calculate the Total Friction Threshold on both legs. The gross spread must exceed TFT by at least 50% to provide a safety margin for execution uncertainty.
Go: Spread = $0.08, combined TFT = $0.04 (50% margin = $0.02, total $0.06. $0.08 > $0.06 ✅) No-Go: Spread = $0.05, combined TFT = $0.04 (50% margin = $0.02, total $0.06. $0.05 < $0.06 ❌)
✅ 2. Resolution Criteria Match
Read the full resolution rules on both platforms. They must reference the same source, the same timeframe, and the same interpretation of the outcome.
Go: Both platforms reference “U.S. Bureau of Labor Statistics, April 2026 Employment Situation Report, seasonally adjusted unemployment rate” No-Go: One references “BLS advance estimate” and the other doesn’t specify which revision
✅ 3. Sufficient Depth on Both Sides
Check the order book on both platforms. Your intended order size must be executable without exceeding 50% of the available depth at the best price on either side.
Go: You want 500 contracts. Best ask on Platform A has 1,200 available. Best bid on Platform B has 1,500 available. No-Go: You want 500 contracts. Best ask on Platform A has 300 available (you’ll experience significant slippage).
✅ 4. Capital Pre-Positioned
You must have funds already available on both platforms. If you need to transfer money to execute, the opportunity will likely close before your transfer settles.
Go: $5,000 available on Polymarket, $5,000 available on Kalshi No-Go: You need to buy USDC and bridge to Polygon first
✅ 5. Time to Resolution Is Acceptable
Calculate your annualized return. If the arb yield is lower than the risk-free rate (Treasury bills, ~4.5% APY), the opportunity cost exceeds the profit.
Go: $0.03 net profit on $0.85 total capital per contract, resolving in 14 days = 92% annualized No-Go: $0.01 net profit on $0.90 total capital per contract, resolving in 90 days = 4% annualized (below risk-free rate)
✅ 6. Both Legs Executable Simultaneously
Can you place both orders within seconds of each other? If one platform is experiencing downtime, high latency, or maintenance, don’t attempt the arb.
Worked Example: A Complete Arbitrage Evaluation
Let’s walk through a realistic arbitrage opportunity from identification to decision.
The Opportunity
Market: “Will the Federal Reserve cut rates in June 2026?”
| Polymarket | Kalshi | |
|---|---|---|
| “Yes” price | $0.34 | $0.42 |
| “No” price | $0.66 | $0.58 |
| Best ask depth (Yes) | 8,200 contracts | N/A (we’re selling) |
| Best bid depth (Yes) | N/A (we’re buying) | 4,100 contracts |
The trade: Buy “Yes” on Polymarket at $0.34. Sell “Yes” on Kalshi at $0.42. Gross spread: $0.08.
Running the Checklist
1. Spread vs. TFT:
| Cost | Polymarket | Kalshi | Total |
|---|---|---|---|
| Spread cost | $0.01 | $0.02 | $0.03 |
| Platform fee | $0.00 | $0.012 | $0.012 |
| Expected slippage (500 contracts) | $0.003 | $0.005 | $0.008 |
| Total TFT | $0.050 |
Net profit: $0.08 – $0.05 = $0.03 per contract 50% safety margin: $0.05 × 1.5 = $0.075. Spread ($0.08) > $0.075 ✅ GO
2. Resolution criteria:
- Polymarket: “Resolves Yes if the FOMC announces a rate cut at the June 2026 meeting per the official FOMC statement”
- Kalshi: “Resolves Yes if the FOMC announces a decrease in the federal funds target rate at the June 2026 meeting per the Federal Reserve press release”
Both reference the same meeting, same action, same official source. ✅ GO
3. Depth: We want 500 contracts. Polymarket ask depth: 8,200 (we need 6% of it). Kalshi bid depth: 4,100 (we need 12% of it). Both well under 50%. ✅ GO
4. Capital pre-positioned: $2,000 available on Polymarket, $3,000 on Kalshi. Cost to buy 500 at $0.34 = $170 (covered). Margin to sell 500 at $0.42 on Kalshi = $290 (covered). ✅ GO
5. Time to resolution: June FOMC meeting is in 62 days. Net profit: $0.03 × 500 = $15. Capital locked: $170 + $290 = $460. Annualized return: ($15 / $460) × (365 / 62) = 19.2% — well above risk-free rate. ✅ GO
6. Simultaneous execution: Both platforms operational. API access available on both. ✅ GO
Decision: Execute
All six checks pass. Place both orders. Expected profit: $15 on $460 of capital over 62 days.
Finding Arbitrage Opportunities
You have three approaches, from lowest effort to most sophisticated:
Approach 1: Manual Scanning
Open Polymarket and Kalshi side by side. Compare prices on the same events. This is slow, limited to the markets you personally check, and likely to miss opportunities — but it costs nothing and requires no technical skills.
Best for: Learning the mechanics. Running your first 2–3 arb trades to understand the process before investing in tooling.
Approach 2: Aggregator Tools
Dedicated tools scan prices across platforms automatically and alert you when spreads exceed configurable thresholds.
| Tool | What It Does | Cost |
|---|---|---|
| ArbBets | Compares prices across prediction market platforms, filters by spread size | Free tier available |
| Eventarb | Cross-platform scanning with Telegram alerts | Free / premium tiers |
| Prediction Hunt | Aggregates Polymarket, Kalshi, and sportsbook odds | Free |
These tools save enormous time — the difference between checking 10 markets manually and scanning 500+ simultaneously.
📍 Full reviews of arbitrage tools → Arbitrage Tools
Approach 3: API-Based Automation
Build or use scripts that query platform APIs, calculate spreads net of friction, and execute automatically when thresholds are met. This is the professional approach.
Capital requirements: $10,000+ across platforms (arbitrage returns are percentage-based; small capital = small dollar returns) Technical requirements: Python or JavaScript, API authentication, on-chain execution for Polymarket Return profile: Consistent but small — think 15–40% annualized on deployed capital in favorable conditions
We don’t cover API implementation in this module (that’s a developer resource), but the conceptual framework here is everything you need to evaluate whether building or subscribing to an automated system is worth your investment.
Honest Assessment: Is Arbitrage Worth It?
Here’s the brutal truth about prediction market arbitrage in 2026:
What works:
- Pre-funded accounts on 2+ platforms with capital sitting ready
- High-volume, well-covered events (Fed decisions, major elections) where price discrepancies are most common and resolution criteria are clearly matched
- Systematic tooling — even simple spreadsheet tracking outperforms casual manual scanning
- Patience — most arb opportunities appear during market volatility (news events, major price swings) and disappear within minutes
What doesn’t work:
- Treating it as passive income. Arb opportunities are intermittent and require active monitoring
- Small capital. A 3% net return on $200 of capital is $6. You can’t build a portfolio on $6 trades
- Ignoring friction. The majority of “opportunities” flagged by scanning tools are not profitable after full TFT calculation
- Cross-regulatory arb (U.S. ↔ non-U.S.). The most common large divergences are between Kalshi and Polymarket — and most individuals can only legally access one of them. This is the single biggest structural barrier to prediction market arbitrage
Realistic expectations:
| Capital Deployed | # Arb Trades / Month | Net Monthly Return | Annualized |
|---|---|---|---|
| $1,000–$5,000 | 2–5 | $10–$50 | 15–25% |
| $5,000–$25,000 | 5–15 | $50–$300 | 20–35% |
| $25,000+ | 10–30 | $200–$1,500 | 20–40% |
These are realistic ranges for a trader using scanning tools and manual execution. API-automated systems at the higher capital tiers can potentially do better through faster execution and broader coverage.
What You Learned
In this module, you learned:
- Cross-platform arbitrage is the purest structural edge but is constrained by four killers: friction, leg risk, non-identical resolution, and capital lock
- The Go/No-Go Checklist (6 items) is your mandatory pre-trade evaluation — skip it at your own risk
- Realistic net profits after friction are typically $0.01–$0.04 per contract, requiring significant volume to generate meaningful returns
- Three approaches to finding arb: manual scanning, aggregator tools, and API automation — each suited to different capital and skill levels
- The biggest barrier is regulatory: the largest arbitrage opportunities (Kalshi ↔ Polymarket) are inaccessible to most individuals due to geographic restrictions
What’s Next
Arbitrage captures structural edge. The next module teaches you to capture analytical edge — using data and models to predict outcomes more accurately than the crowd.
→ Module 3.3: Data-Driven Trading
🎯 Try This Now: Use one of the free aggregator tools (ArbBets, Prediction Hunt, or Eventarb) to find a price divergence on the same event across two platforms you have access to. Run it through the 6-point Go/No-Go Checklist. What’s the gross spread? What’s the TFT on both sides? Do the resolution criteria match? Is the net return above the risk-free rate? You don’t need to trade it — just complete the evaluation exercise. This builds the muscle memory for systematic opportunity assessment.
Predictionist School is a free educational resource from Predictionist.com. We may earn referral commissions from platforms we recommend — see our disclosure policy for details. This content is for educational purposes only and does not constitute financial advice.