
3.5 Strategy: Fundamental Analysis — Single-Actor Markets
Key Takeaways
- Single-actor markets — where one person’s decision determines the outcome — are among the most consistently mispriced events in prediction markets
- The crowd systematically fails at modeling individuals because it applies rational-actor assumptions to people who make decisions based on ideology, ego, emotion, or political calculation
- Reference class forecasting (historical base rates for similar actors in similar situations) is your primary analytical weapon — it corrects for narrative bias
- The best trades come from identifying markets where the crowd is pricing the narrative while you’re pricing the pattern
- This strategy combines analytical and informational edge — you process public information better AND you’ve done deeper research into the specific actor
Scope: This module teaches you to analyze markets where a single individual’s decision is the resolution trigger — political leaders, regulators, executives, and public figures. It applies the analytical edge framework from Module 3.1 and the reference class methodology introduced in Module 3.3. The proprietary personality-typing methodology behind Predictionist’s own trading is beyond the scope of this free curriculum, but the general framework taught here is the foundation.
Why Single-Actor Markets Are Mispriced
Most prediction markets are resolved by aggregated outcomes — election results, economic data, weather measurements. These involve millions of data points and collective behavior. Markets price them reasonably well because the crowd has decent intuition about collective phenomena.
Single-actor markets are different. They’re resolved by one person making one decision. And crowds are terrible at predicting individual behavior.
The Three Failure Modes
Failure Mode 1: The Rational Actor Assumption
The crowd assumes decision-makers will do the “rational” thing — the thing that maximizes their stated objectives. This assumption fails catastrophically when the actor is:
- Ideologically motivated. A politician who genuinely believes in their policy will pursue it even when advisors, polls, and markets say it’s a bad idea
- Emotionally reactive. A leader who perceives a challenge as a personal insult may escalate beyond what any rational analysis would predict
- Incentive-misaligned. A CEO whose compensation is tied to short-term stock price may make decisions that optimize for their bonus, not the company’s long-term health
Failure Mode 2: Narrative Anchoring
The crowd forms a narrative about what an actor “will probably do” based on media coverage, pundit analysis, and social consensus — and then anchors to it even as contradictory evidence accumulates.
Example: A head of state signals a major policy reversal. Media coverage focuses on the political risks (“this would be unprecedented,” “sources close to the leader say it’s unlikely”). The prediction market prices “policy change” at $0.25, reflecting media skepticism. But historical analysis shows that when this specific actor makes public signals of this type, they follow through 70% of the time. The market is pricing the media narrative, not the actor’s pattern.
Failure Mode 3: Base Rate Neglect
The crowd ignores how often similar actors in similar situations have made similar decisions in the past. Instead, they treat each situation as unique and reason from first principles — which, for individual behavior prediction, is systematically less accurate than historical pattern matching.
The Analytical Framework
Step 1: Identify the Decision-Maker
Who actually makes the decision that resolves this market? Not who influences it — who makes the final call?
This is often less obvious than it seems:
| Market Question | Apparent Decision-Maker | Actual Decision-Maker |
|---|---|---|
| “Will the U.S. impose tariffs on X?” | The President | Could be: the President, USTR, or Commerce Secretary depending on the legal mechanism |
| “Will the Fed cut rates?” | The Fed Chair | The FOMC committee (12 voting members, requires majority) |
| “Will Company X acquire Company Y?” | The CEO | The board of directors + shareholders (for large transactions) |
| “Will Country Z leave international agreement?” | The head of state | May require parliamentary vote depending on the country’s constitution |
Getting this wrong means building your entire analysis around the wrong person.
Step 2: Build the Actor Profile
For each decision-maker, research and document:
A. Decision History
What has this person done in similar past situations? This is your base rate.
| Data Point | Where to Find It |
|---|---|
| Previous decisions on the same or similar issues | Government archives, news archives, official records |
| Pattern of follow-through on public statements | Track record of stated intentions vs. actual actions |
| Behavior under pressure (does the actor escalate, compromise, or retreat?) | Historical analysis during previous crises |
| Timing patterns (does the actor decide quickly or deliberate?) | Previous decision timelines |
B. Stated vs. Revealed Preferences
What the actor says they want vs. what their actions reveal:
- Stated: “We will never negotiate on this issue”
- Revealed: Over the past 10 years, the actor has negotiated on similar issues 4 out of 6 times when under sufficient pressure
Revealed preferences are more predictive than stated preferences. Always weigh actions over words.
C. Stakeholder Mapping
Who influences this actor’s decisions? No leader decides in a vacuum.
- Who are their key advisors?
- What constituencies do they need to satisfy?
- What are the personal incentives (re-election, legacy, financial)?
- What are the institutional constraints (Congressional approval, party discipline, legal authority)?
Step 3: Establish the Reference Class
This is the most important step — and the one the crowd almost always skips.
Reference class forecasting asks: “What happened in historical situations that are structurally similar to this one?”
Example: “Will President X fire Cabinet Secretary Y?”
Instead of reasoning from the current drama (media speculation, leaked memos, Twitter fights), you ask:
- How many cabinet secretaries have been fired by this president? (2 out of 15 so far)
- How many publicly criticized cabinet secretaries were eventually fired vs. retained across all modern presidents? (Roughly 40% fired within 6 months of first public criticism)
- Does this president tend to fire people quickly or tolerate dysfunction? (Historical pattern: tolerates for 3–6 months, then acts suddenly)
Your base rate: ~40%, adjusted for this president’s specific pattern → ~35%.
The market might be at $0.55 because of intense media speculation about an “imminent firing” — pricing the narrative intensity rather than the historical frequency.
Step 4: Calibrate with Current Evidence
Starting from your reference class base rate, adjust for specific current evidence:
| Evidence Type | Direction | Strength |
|---|---|---|
| Public statements by the actor directly addressing the decision | Strong signal if the actor has a high follow-through rate; weak if they frequently bluff | Variable |
| Internal signals (advisor resignations, staff leaks, policy documents) | Strong — internal actions are harder to fake than public statements | High |
| External pressure (polls, economic data, allied government pressure) | Important for actors who respond to external pressure; irrelevant for ideological actors | Depends on actor profile |
| Timing indicators (scheduled meetings, deadlines, legislative calendars) | Constrains the when, which is crucial for markets with specific timeframes | High |
Step 5: Price Your Estimate and Trade the Gap
Your final probability estimate = Reference class base rate + current evidence adjustments.
Compare this to the market price. If the gap exceeds your TFT, you have a trade.
Worked Example: A Regulatory Decision
Market: “Will the FTC block the proposed merger of Company A and Company B?”
Step 1 — Decision-maker: The FTC Chair, with a 3-2 commission vote.
Step 2 — Actor profile:
- Current FTC Chair has voted to block or challenge 7 of 12 large mergers brought to a vote
- The Chair has publicly stated a “presumption of illegality” for mergers above $5B in concentrated industries
- The Chair tends to act approximately 4–6 months after announcing a formal review
Step 3 — Reference class:
- Historical base rate: FTC has formally challenged ~35% of large mergers it reviewed (2015–2025)
- Under this Chair: challenge rate is ~58% (significantly more aggressive than predecessors)
- In the specific industry sector: 4 out of 8 proposed mergers were challenged in the last 10 years (50%)
Base rate selection: Under this Chair in this sector → ~55%
Step 4 — Current evidence:
| Evidence | Direction | Adjustment |
|---|---|---|
| Chair gave a speech last week criticizing “monopolistic consolidation” in this exact sector | Bullish (toward blocking) | +5% |
| Two of five commissioners publicly expressed skepticism about the merger | Bullish | +8% (strong signal — suggests 3-2 vote to block) |
| Merging companies offered significant divestitures to address antitrust concerns | Bearish (toward approval) | −10% |
| Industry lobby ramped up pressure campaign, which historically makes this Chair more aggressive | Bullish | +3% |
Revised estimate: 55% + 5% + 8% − 10% + 3% = 61%
Step 5 — Market comparison:
- Market price: $0.40 (implying 40% probability of blocking)
- Gap: 21 percentage points
- TFT: ~2% on Polymarket
Assessment: Large gap, well-supported by both the reference class and current evidence. The market appears anchored to the historical average (35%) rather than this specific Chair’s pattern (58%). Trade.
Common Pitfalls in Single-Actor Analysis
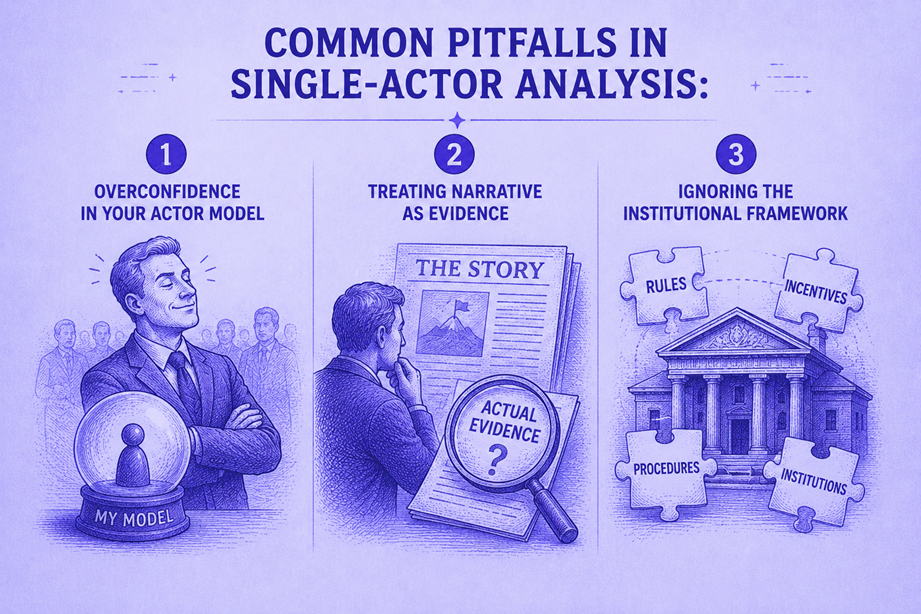
Pitfall 1: Overconfidence in Your Actor Model
You’ve researched this person for hours. You feel like you “know” how they think. This feeling is dangerous.
Reality: All actor models are approximations. People surprise. The actor may have private information, hidden motivations, or undergo genuine changes in perspective that your public-information model can’t capture.
Mitigation: Never assign a probability above 90% or below 10% to any single-actor decision unless the decision has been publicly pre-committed and is functionally irreversible.
Pitfall 2: Treating Narrative as Evidence
A compelling story about why an actor will or won’t do something is not evidence. It’s a hypothesis. Evidence is:
- What the actor has done in similar past situations (behavior)
- What the actor’s direct statements are (words — weighted by follow-through rate)
- What the actor’s observable actions indicate (internal signals)
Media interpretations, pundit opinions, and “sources say” reporting are narratives, not evidence. They may point you toward evidence, but they are not substitutes.
Pitfall 3: Ignoring the Institutional Framework
Even in “single-actor” markets, institutions constrain individual behavior. A president who wants to impose tariffs may be constrained by law, congressional approval, or trade agreements. A CEO who wants to make an acquisition needs board approval and regulatory clearance.
Always map the institutional constraints before modeling the actor’s preferences. The question isn’t just “what does this person want to do?” — it’s “what can this person do?”
What You Learned
In this module, you learned:
- Single-actor markets are systematically mispriced because crowds apply rational-actor assumptions to emotionally and ideologically driven decision-makers
- A 5-step analytical framework — identify the decision-maker, build the actor profile, establish the reference class, calibrate with current evidence, and compare to market price — provides disciplined analysis
- Reference class forecasting is the single most powerful technique: what happened when similar actors faced similar situations?
- Stated vs. revealed preferences are different — always weight actions over words, scaled by the actor’s historical follow-through rate
- Three common pitfalls — overconfidence, treating narrative as evidence, and ignoring institutional constraints — can turn good analysis into bad trades
What’s Next
The final strategy module covers the most sophisticated structural edge: market making — providing liquidity on both sides of a market and earning the spread. This is where prediction market trading meets quantitative finance.
🎯 Try This Now: Find an active prediction market where a specific individual’s decision is the resolution trigger (a political leader, regulator, or executive). Identify the person. Research their last 5 decisions in similar situations. Calculate the base rate. Now compare that to the market price. Is the market pricing the narrative or the pattern? Write down your estimate, the market price, and the gap. Watch how the market evolves as the decision approaches — and whether the final outcome aligns with your pattern-based estimate or the market’s narrative-based price.
Predictionist School is a free educational resource from Predictionist.com. We may earn referral commissions from platforms we recommend — see our disclosure policy for details. This content is for educational purposes only and does not constitute financial advice.