
4.3 Portfolio Construction
Key Takeaways
- A prediction market portfolio is not a collection of individual bets — it’s a system of correlated exposures that must be managed as a whole
- Correlation between positions is the hidden risk that destroys portfolios — two markets that seem independent often move together when the underlying catalyst changes
- Maximum total exposure (sum of all open positions) should never exceed 50% of your bankroll — the other 50% is dry powder for new opportunities and drawdown protection
- Diversification across time horizons, event categories, strategies, and platforms is more important than any single trade
- Portfolio-level thinking separates professionals from enthusiasts — it’s the difference between gambling on individual events and building a systematic edge
Scope: This module teaches portfolio-level risk management for prediction market traders holding multiple simultaneous positions. It builds on the position sizing from Module 4.1 and the strategy diversification from Level 3.
From Single Trades to Portfolios
Everything you’ve learned so far — entry criteria, sizing, exit rules — operates at the trade level. But the moment you hold more than one position, new risks emerge that don’t exist at the individual trade level.
The most dangerous: correlation.
What Correlation Looks Like in Prediction Markets
Scenario: You hold five positions:
| Position | Market | Direction | Size |
|---|---|---|---|
| 1 | “Fed cuts in June” | Yes ($0.42) | $500 |
| 2 | “Unemployment above 4.5% in May” | Yes ($0.55) | $400 |
| 3 | “S&P 500 below 5,000 by July” | Yes ($0.25) | $300 |
| 4 | “GDP growth below 2%” | Yes ($0.38) | $450 |
| 5 | “Bitcoin above $150K by July” | No ($0.70) | $350 |
Each position passes your individual trade criteria. Each is sized within the 5% rule. You feel diversified — five different markets across different categories.
The problem: All five positions are essentially the same bet: the U.S. economy weakens. If the economy strengthens — strong jobs report, GDP surprise, Fed hawkishness — all five positions move against you simultaneously. Your “diversified” portfolio is actually a concentrated directional bet with $2,000 of exposure.
This is how portfolios blow up. Not through one bad trade, but through correlated losses across positions that felt independent but weren’t.
The Correlation Matrix
Before adding any new position, assess its correlation with your existing portfolio:
Correlation Categories
| Correlation Level | Definition | Example |
|---|---|---|
| High (+) | Both positions move in the same direction for the same reason | “Fed cuts” + “Unemployment rises” — both driven by economic weakness |
| Low / None | Positions move independently | “Fed cuts” + “Oscar Best Picture winner” — no common driver |
| Negative (−) | Positions move in opposite directions | “Fed cuts” + “Inflation above 3%” — rate cuts are less likely if inflation is high |
The Portfolio Correlation Rule
No more than 30% of your total portfolio exposure should be correlated to the same underlying catalyst.
In the example above, all five positions (~$2,000) are correlated to the “economic weakness” catalyst. If your total bankroll is $10,000, that’s 20% — within the rule. But if your bankroll is $4,000, it’s 50% — a dangerous concentration.
Building a Truly Diversified Portfolio
Diversify across four dimensions:
1. Event category
- Mix: politics + economics + crypto + weather + culture
- No single category should exceed 40% of your total exposure
2. Time horizon
- Mix: short-term (resolves within 2 weeks) + medium (1–3 months) + long-term (3+ months)
- Prevents capital lock-up and ensures continuous turnover
3. Strategy type
- Mix: data-driven + bias exploitation + arbitrage + fundamental analysis
- Each strategy has different market condition dependencies
4. Platform
- If possible, spread positions across Kalshi, Polymarket, and other platforms
- Reduces platform-specific risk (outages, resolution disputes, regulatory changes)
Exposure Limits
Maximum Total Exposure: 50% of Bankroll
The sum of all open positions should never exceed half your bankroll. This ensures:
- You have capital to deploy on new high-conviction opportunities
- A correlated drawdown across your portfolio doesn’t wipe you out
- You have liquidity to exit positions in an emergency
Maximum Single-Position Size: 5% of Bankroll
This is the floor rule from Module 1.4, reinforced by the Quarter Kelly sizing from Module 4.1.
Maximum Correlated Exposure: 30% of Bankroll
No single underlying catalyst should drive more than 30% of your portfolio’s total value. If you catch yourself loading up on positions that all benefit from the same outcome, you need to either reduce existing positions or offset with a negatively correlated position.
Summary Table
| Limit | Rule |
|---|---|
| Total exposure | ≤ 50% of bankroll |
| Single position | ≤ 5% of bankroll |
| Correlated cluster | ≤ 30% of bankroll |
| Single category | ≤ 40% of total exposure |
| Single platform | ≤ 60% of total exposure |
Portfolio Rebalancing
Your portfolio composition changes over time as:
- Prices move (successful positions grow; losing positions shrink)
- Markets resolve (capital returns to your available balance)
- New opportunities appear (you want to enter new positions)
When to Rebalance
| Trigger | Action |
|---|---|
| A position has grown to >7% of bankroll (due to price movement in your favor) | Consider taking partial profit to bring it back to 5% |
| Correlated cluster exceeds 30% | Reduce the most marginal position in the cluster |
| Total exposure exceeds 50% | Close your lowest-conviction open position |
| A higher-conviction opportunity appears but you’re at capacity | Close your lowest-conviction existing position to free capital |
| A position’s edge has evaporated (market price converged to your estimate) | Close and redeploy the capital |
Rebalancing Frequency
- Check exposure limits daily if you’re actively trading (takes 2 minutes — just scan your portfolio summary)
- Full rebalancing review weekly as part of your journal review
- Don’t over-rebalance — each close/open incurs friction. Only rebalance when limits are breached or a materially better opportunity arises
Worked Example: A Balanced Portfolio
Bankroll: $10,000
| # | Market | Category | Strategy | Platform | Size | % of Bankroll |
|---|---|---|---|---|---|---|
| 1 | Fed June decision | Economics | Data-driven | Kalshi | $500 | 5% |
| 2 | French election runoff | Politics | Fundamental | Polymarket | $400 | 4% |
| 3 | BTC > $150K by Sept | Crypto | Data-driven | Polymarket | $350 | 3.5% |
| 4 | NYC 95°F in July | Weather | Data-driven | Kalshi | $300 | 3% |
| 5 | Oscar Best Picture | Culture | Bias (longshot) | Polymarket | $200 | 2% |
| 6 | UK rate hold July | Economics | Fundamental | Polymarket | $400 | 4% |
| 7 | Longshot basket (8 markets) | Mixed | Bias exploitation | Polymarket | $500 | 5% |
| 8 | Fed/Kalshi arb pair | Economics | Arbitrage | Both | $450 | 4.5% |
Portfolio check:
| Limit | Actual | Status |
|---|---|---|
| Total exposure | $3,100 (31%) | ✅ Well below 50% |
| Largest position | $500 (5%) | ✅ At limit |
| Economics cluster (#1, #6, #8) | $1,350 (13.5%) | ✅ Below 30% |
| Single platform max (Polymarket) | $1,850 (18.5%) | ✅ Below 60% |
| Categories | 5 different | ✅ Well diversified |
| Time horizons | 2 weeks to 5 months | ✅ Staggered |
| Strategies | 4 different | ✅ Diversified |
This portfolio has genuine diversification across all four dimensions. No single event, catalyst, platform, or strategy can create a catastrophic loss.
How to Identify Correlations in Practice
Correlation in prediction markets is often non-obvious. Two markets that appear unrelated can become correlated when the underlying information environment shifts.
The “Same Headline” Test
For every pair of positions in your portfolio, ask: “Is there a single news headline that would move both of these positions in the same direction?”
If yes, they’re correlated. Examples:
| Headline | Affected Positions | Correlation Type |
|---|---|---|
| “U.S. unemployment surges to 5.2%” | Fed cut markets ↑, GDP markets ↓, recession markets ↑ | Economic macro cluster |
| “Trump announces tariffs on EU goods” | EU trade markets, EUR/USD markets, European election markets | Geopolitical cluster |
| “Bitcoin ETF sees record outflows” | BTC price threshold markets, crypto adoption markets, DeFi volume markets | Crypto cluster |
The “Stress Scenario” Exercise
Once per week (during your journal review), run this exercise:
- Pick the worst realistic scenario for your portfolio — the single event that would damage the most positions
- Estimate the impact on each open position: how much would each move against you?
- Sum the total potential loss across all affected positions
- If that sum exceeds 15% of your bankroll, your portfolio is too concentrated around that scenario — reduce correlated exposure
Natural Hedges
Some positions naturally hedge each other. If you hold both “Fed cuts in June — Yes” AND “Inflation above 3.5% — Yes,” these are partially offsetting: high inflation makes a Fed cut less likely, so if one position loses, the other tends to gain.
Incorporating natural hedges into your portfolio doesn’t eliminate risk — but it reduces your exposure to single-catalyst blowups.
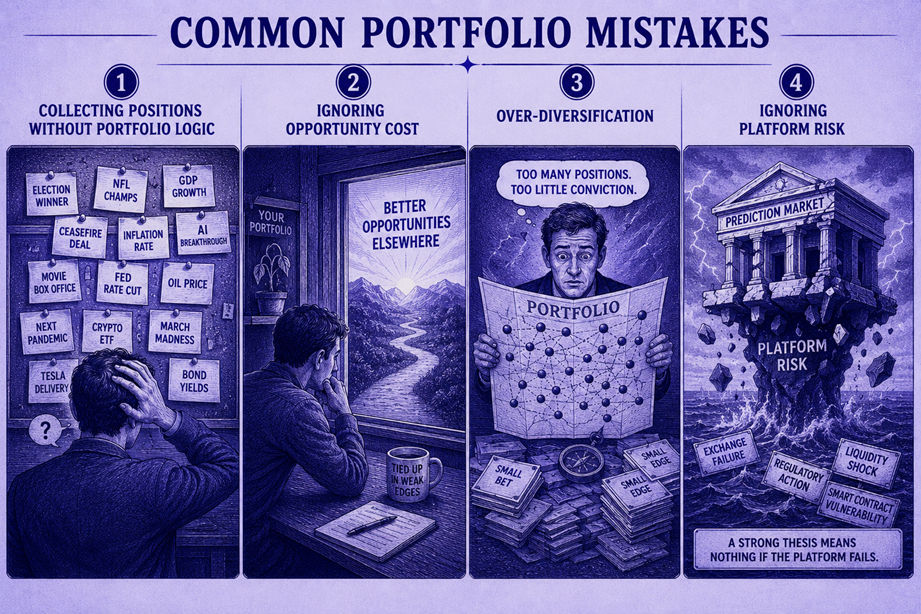
Common Portfolio Mistakes
Mistake 1: Collecting Positions Without Portfolio Logic
Many traders accumulate positions opportunistically — each trade makes sense individually, but the portfolio has no structural integrity. This is “position collection,” not portfolio construction. Every new position should be evaluated against your existing portfolio, not in isolation.
Mistake 2: Ignoring Opportunity Cost
Capital is finite. Every dollar in an existing position is a dollar unavailable for new opportunities. If you’re holding a position with a 3% edge when a new opportunity offers 15% edge, the rational move is to close the weaker position and redeploy — even if the weaker position is still “profitable.” Portfolio management is constant optimization, not buy-and-hold.
Mistake 3: Over-Diversification
There is such a thing as too many positions. With 50 open positions on a $10,000 bankroll, each position is $200 (2%) — generating tiny dollar returns while requiring significant monitoring effort. The overhead of tracking, updating estimates, and managing 50 positions exceeds the value. 10–25 positions is the sweet spot for most individual traders.
Mistake 4: Ignoring Platform Risk
If 90% of your portfolio is on a single platform and that platform experiences a multi-day outage, a resolution dispute, or a regulatory action, your entire portfolio is at risk. Spreading across platforms isn’t just diversification — it’s disaster insurance.
What You Learned
- Correlation is the hidden portfolio killer — positions that seem independent often share underlying catalysts
- Three exposure limits protect your portfolio: 50% total, 5% single position, 30% correlated cluster
- Four diversification dimensions — event category, time horizon, strategy type, and platform — create genuine protection
- Rebalancing is necessary but should be infrequent — only when limits are breached or materially better opportunities emerge
- Portfolio-level thinking is the transition from trading to investing — it’s where prediction market activity becomes sustainable
What’s Next
You have a system, a journal, and a portfolio framework. The next module addresses the force that undermines all three: your own psychology.
→ Module 4.4: Trading Psychology
🎯 Try This Now: List all your current open prediction market positions (or hypothetical ones). For each, identify the underlying catalyst — what economic, political, or structural force drives the outcome? Group positions by catalyst. Does any single catalyst drive more than 30% of your exposure? If so, you’ve found a correlation risk that needs to be addressed before your next trade.
Predictionist School is a free educational resource from Predictionist.com. We may earn referral commissions from platforms we recommend — see our disclosure policy for details. This content is for educational purposes only and does not constitute financial advice.