
4.5 The Superforecaster Mindset
Key Takeaways
- Superforecasters — the top 2% of predictors in Philip Tetlock’s research — aren’t geniuses; they’re disciplined thinkers who follow specific, learnable habits
- The three core habits are: granular probability estimation, continuous updating, and thinking in base rates — all of which you’ve already practiced throughout this curriculum
- Foxes beat hedgehogs: people who integrate diverse perspectives and adjust frequently outperform those who build grand theories and commit to them
- Calibration — the match between your confidence and your accuracy — is the meta-skill that separates good traders from great ones
- Superforecasting is not a talent — it’s a practice that improves with deliberate effort and honest self-assessment
Scope: This module synthesizes the intellectual framework behind the entire Predictionist School curriculum. It draws on Philip Tetlock’s Superforecasting research, applies its principles specifically to prediction market trading, and ties together the analytical methods from Levels 1–3 with the operational practices from Level 4. Consider this the philosophical capstone of the course.
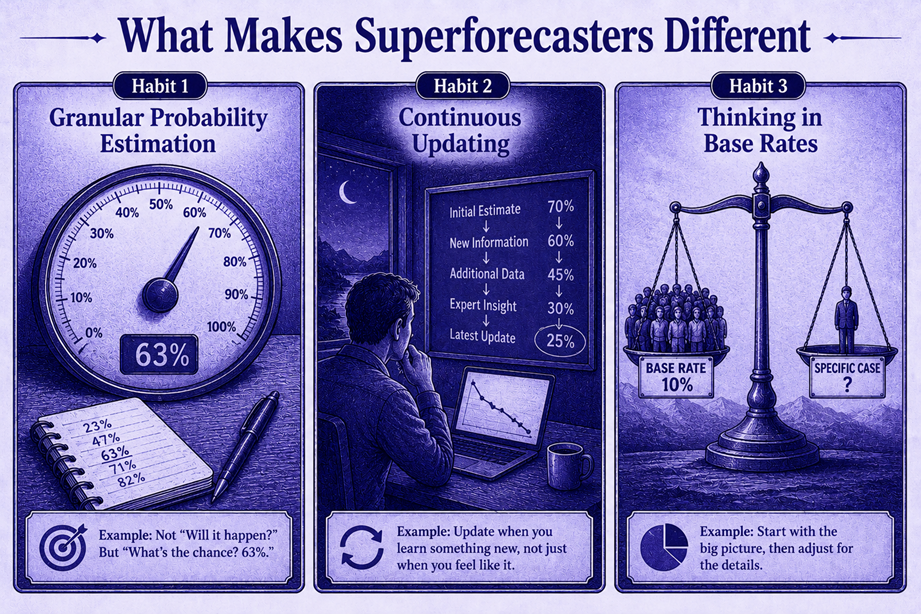
What Makes Superforecasters Different
Between 2011 and 2015, Philip Tetlock’s Good Judgment Project ran the largest forecasting tournament in history, sponsored by the U.S. intelligence community (IARPA). Thousands of ordinary people made predictions about geopolitical, economic, and social events. The results were striking:
- The top 2% of forecasters (dubbed “superforecasters”) outperformed professional intelligence analysts with access to classified data
- Superforecasters beat prediction markets by ~15–30% on accuracy (Brier score)
- Their advantage was not better information — it was better processing of the same public information available to everyone
What did they do differently? Three things.
Habit 1: Granular Probability Estimation
The Pattern
Average forecasters think in buckets: “likely,” “unlikely,” “toss-up.” Superforecasters think in precise probabilities: “67%,” “43%,” “12%.”
This matters because the space between “likely” (interpreted as anywhere from 55% to 90%) and a specific “73%” is enormous in terms of expected value. A prediction market trader who thinks in “likely” will overpay for contracts priced above $0.55 and underpay for contracts priced below $0.90 — unable to identify the mispricing because their own estimate is too vague to compare.
How to Practice
You’ve been practicing this throughout the curriculum:
- Module 3.3 taught you to derive probabilities from base rates and evidence
- Module 4.2 taught you to record your estimates numerically for Brier scoring
- Module 4.4 warned you about anchoring and overconfidence that corrupt your estimates
The key practice that accelerates granularity is distinguishing between adjacent probabilities. Ask yourself: “Is this 65% or 70%?” The fact that you can articulate why it’s one versus the other — citing a specific piece of evidence that shifts the estimate by 5 points — is the muscle that superforecasters develop.
The Practical Test
If someone asks you “what’s the probability of X?” and you answer “it’s likely” — stop. Translate that into a number. Is it 60%? 75%? 83%? The specific number forces you to confront what you actually know and don’t know.
Habit 2: Continuous Updating
The Pattern
Average forecasters form an opinion and defend it. Superforecasters form an estimate and update it continuously as new evidence arrives.
The distinction is subtle but critical:
- Defending an opinion means treating contradictory evidence as an attack on your identity. You look for reasons to dismiss it
- Updating an estimate means treating contradictory evidence as information. You incorporate it and adjust your number
Tetlock’s research found that superforecasters updated their estimates 3–4× more frequently than average forecasters. These weren’t wild swings — they were small, disciplined adjustments: moving from 63% to 58% after a piece of evidence, then to 61% after another.
The Bayesian Mindset
This is applied Bayesian reasoning:
Prior probability + New evidence → Updated probability
You don’t start over with each piece of evidence. You adjust your existing estimate proportionally to the strength and relevance of the new information:
| Evidence Strength | Typical Adjustment |
|---|---|
| Strong, direct (official data release that directly bears on the question) | 5–15 percentage points |
| Moderate (credible analysis, relevant but indirect data) | 2–5 percentage points |
| Weak (rumor, social media speculation, pundit opinion) | 0–2 percentage points |
| No informational content (noise, entertainment, clickbait) | 0 points — IGNORE |
The hardest part is assigning zero adjustment to weak signals. Most people feel compelled to update on every piece of information, even when it’s noise. Superforecasters are disciplined about ignoring noise.
Connection to Trading
Every update to your probability estimate should trigger a reassessment of your open positions:
- If your updated estimate moves closer to the market price → your edge is shrinking. Consider closing
- If your updated estimate moves further from the market price → your edge is growing. Consider adding (within sizing limits)
- If your updated estimate crosses the market price → your thesis has flipped. Close the position immediately
Habit 3: Thinking in Base Rates
The Pattern
When asked “will X happen?”, average forecasters reason from the specific case: the current narrative, the personalities involved, the emotional tenor of the situation.
Superforecasters start from the outside view: how often has this type of thing happened historically?
This is reference class forecasting — introduced in Module 3.3 and applied in Module 3.5 — and it is the single most powerful technique in the superforecaster toolkit.
Why Base Rates Are So Powerful
Base rates correct for a universal human tendency: treating every situation as unique. While every situation feels unique, most situations have historical precedent that provides a strong starting point.
Without base rates: “I think the Fed will cut because inflation is falling and they need to support growth.” (Might be right, might be wrong — no way to calibrate confidence.)
With base rates: “Historically, when inflation decelerated from above 4% to below 3.5% with unemployment above 4%, the Fed cut within 6 months 68% of the time. Current conditions match this pattern.” (Now you have a calibrated starting point that’s grounded in data.)
The Inside View vs. Outside View
| Approach | Method | Accuracy |
|---|---|---|
| Inside view | Reason from the specifics of this case. Focus on narratives, personalities, and the feeling of the moment | Systematically overconfident. Vulnerable to narrative bias |
| Outside view | Start from the historical base rate for this class of event. Then adjust for specifics | More accurate. Forces humility about what you don’t know |
| Combined (what superforecasters do) | Start from the outside view. Then adjust inward based on case-specific evidence | Best accuracy. Base rate provides the anchor; specifics provide the fine-tuning |
The Fox vs. The Hedgehog
Tetlock’s earlier research (2005) established a powerful distinction:
- Hedgehogs know one big thing. They have a grand theory of how the world works and apply it to every question. They’re confident, consistent, and frequently wrong
- Foxes know many things. They draw on diverse sources, consider multiple perspectives, and adjust their views. They’re uncertain, inconsistent, and significantly more accurate
In prediction market terms:
| Trait | Hedgehog Trader | Fox Trader |
|---|---|---|
| Analysis style | Applies one framework to every market | Uses different frameworks for different market types |
| Confidence | High confidence on every trade | Variable confidence — high only when evidence is strong |
| Updating | Resists changing views | Updates frequently based on new evidence |
| Response to being wrong | Explains why the outcome was a fluke | Investigates what their model missed |
| Long-term performance | Worse than chance (in Tetlock’s data) | Significantly better than chance |
The implication for your trading: If you find yourself applying the exact same analytical approach to Fed decisions, crypto prices, weather events, and geopolitics — you’re being a hedgehog. Different market categories require different tools. Level 3 of this curriculum gave you five different strategies precisely because no single approach works everywhere.
Calibration: The Meta-Skill
Calibration is the match between your confidence and your accuracy:
- If you assign 70% probability to 100 events, and 70 of them happen, you’re perfectly calibrated
- If 85 of them happen, you’re underconfident (you should have said 85%)
- If 55 of them happen, you’re overconfident (you should have said 55%)
Why Calibration Matters for Traders
In prediction markets, calibration directly translates to profit. A trader who consistently assigns 70% probability to events that happen 70% of the time will correctly identify mispricings — because the market will sometimes price those events at 60% or 80%, and the calibrated trader will know the true rate.
An uncalibrated trader can’t distinguish between a genuine mispricing and their own estimation error.
How to Improve Calibration
- Track your predictions. Your trading journal (Module 4.2) is your calibration dataset
- Calculate your Brier score regularly. Monthly, compare your estimates to outcomes
- Build calibration curves. Group your predictions by confidence level (50–59%, 60–69%, 70–79%, etc.) and compare to actual hit rates. The closer each group is to its midpoint, the better your calibration
- Practice with low-stakes questions. Metaculus, Good Judgment Open, and similar forecasting platforms let you make many predictions quickly, building calibration experience faster than trading alone
The Calibration Curve
Perfect calibration looks like a straight diagonal line from (0%, 0%) to (100%, 100%). Most people’s actual calibration curves show:
- Overconfidence at the extremes: They assign 90% to events that happen ~78% of the time, and 10% to events that happen ~18% of the time
- Bunching in the middle: They assign 50–60% to most events, avoiding extreme probabilities. This is “uncertainty aversion” — the reluctance to commit to strong predictions even when evidence warrants it
Superforecasters show nearly flat calibration curves — meaning their 30% predictions happen about 30% of the time, their 70% predictions about 70%, and so on. This doesn’t come naturally. It comes from thousands of predictions with honest feedback.
How to Practice Superforecasting
Daily: The Two-Minute Estimation Habit
Pick one question each day — from prediction markets, the news, or your personal life — and assign it a precise probability. Write it down. Don’t agonize; spend no more than two minutes.
Examples:
- “Will it rain in my city tomorrow?” → 72%
- “Will this meeting run over 30 minutes?” → 45%
- “Will Bitcoin close above $130K today?” → 35%
The point isn’t accuracy on any single question. The point is building the muscle of thinking in precise probabilities instead of fuzzy impressions. After 90 days of daily practice, you’ll notice your estimates becoming more naturally granular.
Weekly: The Prediction Tournament
Platforms like Metaculus and Good Judgment Open run continuous forecasting tournaments where you can make predictions on real-world events and track your accuracy over time. Spend 30 minutes per week:
- Browse 3–5 active questions relevant to your trading focus
- Assign probabilities using the full process: base rate → evidence adjustment → estimate
- Log your predictions
- Update existing predictions when new evidence arrives
This provides high-volume calibration practice — far more predictions per month than trading alone generates, which accelerates the feedback loop.
Monthly: The Calibration Review
During your monthly journal review, add a calibration analysis:
- Group all resolved predictions by confidence bucket (50–59%, 60–69%, 70–79%, etc.)
- Calculate the actual hit rate for each bucket
- Plot the results. Perfect calibration = a straight diagonal line
- Identify your systematic errors: are you overconfident? Underconfident? Bunched in the middle?
- Consciously correct: if your “80% bucket” is hitting at 65%, start mentally translating your 80% feelings into 65% estimates
What You Learned
- Superforecasters outperform experts not through better information but through better processing — granular estimation, continuous updating, and base rate thinking
- Foxes beat hedgehogs — diverse perspectives and adaptive thinking outperform grand theories
- Calibration is the meta-skill: the ability to accurately match your confidence to your accuracy, directly translating to trading profit
- The outside view (base rates) corrected by the inside view (case-specific evidence) is the optimal analytical approach
- Superforecasting is a practice, not a talent — it improves with deliberate effort, and your trading journal provides the feedback loop
What’s Next
This is the final conceptual module. The last module in the curriculum brings everything together into a personal, actionable trading plan — your roadmap for applying everything you’ve learned.
→ Module 4.6: What’s Next — Your Trading Plan
🎯 Try This Now: Make 10 probabilistic predictions about events that will resolve within the next 30 days — any category. Write each one as a precise probability (e.g., “72% that X will happen by Y date”). Record them in your journal. After 30 days, score them: calculate the Brier score for all 10. This is your baseline calibration. Repeat monthly. Watch your calibration improve.
Predictionist School is a free educational resource from Predictionist.com. We may earn referral commissions from platforms we recommend — see our disclosure policy for details. This content is for educational purposes only and does not constitute financial advice.