
2.3 Fees, Spreads, and the True Cost of Trading
Key Takeaways
- The price you see on screen is never the price you actually pay — your true cost includes the spread, platform fees, slippage, gas, and funding costs
- The Total Friction Threshold (TFT) is the minimum edge you need just to break even on a trade — if your analytical edge is smaller than TFT, the trade loses money
- Fees vary from <1% (Polymarket) to 20%+ (legacy PredictIt) — this single factor can make the difference between a profitable strategy and a guaranteed loser
- Understanding the full fee stack — and calculating it for every trade — transforms you from someone who “thinks they’re profitable” into someone who knows
- The best way to reduce friction isn’t finding the cheapest platform — it’s trading smarter: limit orders, larger liquid markets, and fewer unnecessary round-trips
Scope: This module quantifies the complete cost of prediction market trading. It builds on the fee overview from Module 1.2 and the spread mechanics from Module 2.1. It does not cover Strategy-specific cost optimization (that’s integrated into each Level 3 module).
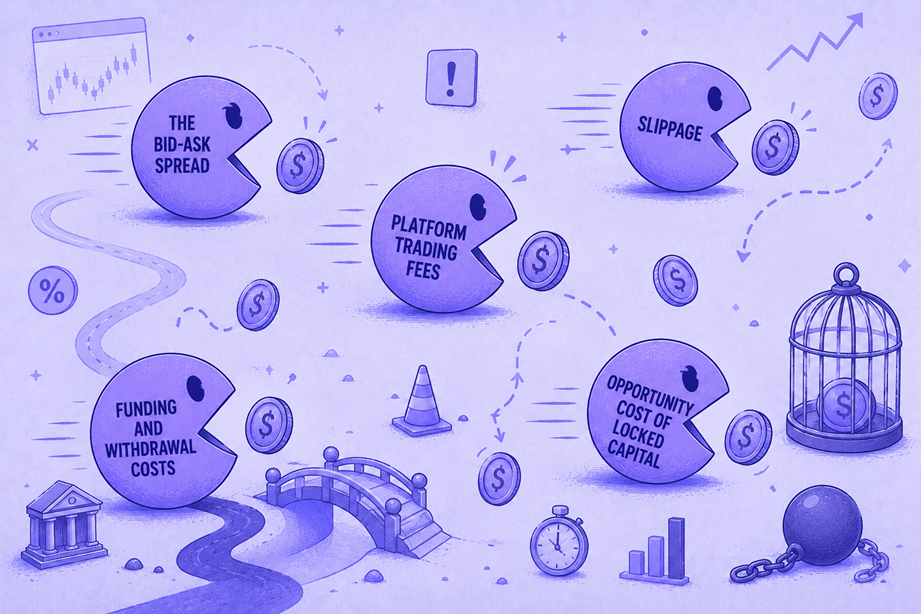
The Fee Stack: Five Layers of Cost
Every prediction market trade carries costs across five layers. Most traders only think about one or two of them. The professionals think about all five.
Layer 1: The Bid-Ask Spread
This is the most significant cost for most traders, and we covered it in Module 2.1. Here’s the key point restated: the spread is a cost you pay every time you enter or exit a position at market.
If the bid is $0.53 and the ask is $0.57, and you buy at the ask and later sell at the bid (with no price movement), you’ve lost $0.04 per contract — 4 cents of pure friction.
Spread costs by platform and market type:
| Market Type | Polymarket | Kalshi | ForecastEx | Limitless |
|---|---|---|---|---|
| Major political | $0.01–$0.02 | $0.02–$0.03 | $0.02–$0.04 | $0.03–$0.06 |
| Economic (Fed, GDP) | $0.02–$0.03 | $0.02–$0.04 | $0.02–$0.05 | $0.04–$0.08 |
| Crypto milestones | $0.01–$0.03 | $0.03–$0.05 | N/A | $0.02–$0.05 |
| Niche / long-tail | $0.05–$0.15+ | $0.05–$0.10+ | N/A | $0.08–$0.20+ |
The takeaway: Spread costs are not fixed. They depend on the specific market’s liquidity. A tight spread on U.S. election markets doesn’t mean every market on that platform has a tight spread.
Layer 2: Platform Trading Fees
These are the explicit fees charged by the platform per trade:
| Platform | Fee Structure | How It’s Applied |
|---|---|---|
| Polymarket | No explicit fee | Costs embedded in CLOB spread and USDC gas |
| Kalshi | Variable per contract type | Charged on trade execution; varies by market event category |
| ForecastEx | Exchange fee + IBKR commission | Standard brokerage fee model |
| FanDuel Predicts | 1% of wager, capped at $5 | Charged per trade |
| Limitless | 0.03%–3% dynamic | Lower fees on high-probability outcomes; higher on longshots |
| Robinhood | No explicit fee | Revenue via payment for order flow (embedded in pricing) |
Layer 3: Slippage
Covered in depth in Module 2.1. Slippage costs are proportional to your order size relative to the available depth. Quick reference:
| Order Size Relative to Best Price Depth | Expected Slippage |
|---|---|
| <25% of depth at best price | Negligible (0–$0.005) |
| 25–75% of depth at best price | Minor ($0.005–$0.015) |
| 100%+ of depth at best price | Significant ($0.015–$0.05+) |
Layer 4: Funding and Withdrawal Costs
Getting money into and out of platforms carries its own costs:
| Platform | Deposit Cost | Withdrawal Cost |
|---|---|---|
| Polymarket | Card: | Gas only (~$0.01–$0.10 on Polygon). Bridge to ETH mainnet: $2–$15 |
| Kalshi | ACH: free (1–3 day delay). Debit: ~1.5% fee. Wire: bank fees apply | ACH: free |
| ForecastEx | Standard IBKR deposit methods (free for ACH) | Standard IBKR withdrawal (free for ACH) |
| FanDuel | Standard FanDuel payment methods | Standard FanDuel withdrawal |
The hidden cost for crypto platforms: If you’re buying USDC specifically to trade on Polymarket, the fiat-to-USDC conversion (via Coinbase, exchange, or onramp) typically costs 1–2.5%. This is a one-time cost, but for small accounts it can be significant.
Layer 5: Opportunity Cost of Locked Capital
This is the most overlooked cost. When your capital is in an open prediction market position, it’s not earning yield elsewhere. For reference:
- U.S. Treasury bills yield ~4.5% APY (as of early 2026)
- A typical prediction market position locks capital for 1–8 weeks
- ForecastEx is the only platform that pays yield on collateral, partially offsetting this cost
Example: You lock $10,000 in a Polymarket position for 4 weeks. During that time, the same $10,000 in T-bills would have earned ~$35 in risk-free interest. That $35 is a real cost of your trade — you need to earn at least that much in trading profit just to match the opportunity cost.
For casual traders with small accounts, opportunity cost is negligible. For serious traders managing five-figure portfolios across multiple markets, it’s a line item that needs to be tracked.
Total Friction Threshold (TFT): Your Break-Even Edge
The Total Friction Threshold is the sum of all five cost layers for a specific trade. It represents the minimum analytical edge you need just to break even.
Calculating TFT
Formula:
TFT = Spread Cost + Platform Fee + Expected Slippage + Funding Cost (amortized) + Opportunity Cost
Worked Example 1: A Kalshi Trade
You want to buy 100 “No” contracts on a Fed rate decision market.
| Cost Layer | Calculation | Amount |
|---|---|---|
| Spread | Bid/ask spread = $0.03. You cross at the ask | $3.00 |
| Platform fee | Kalshi fee ~2% on $65 position | $1.30 |
| Slippage | Small order, negligible | $0.00 |
| Funding | ACH deposit, free | $0.00 |
| Opportunity cost | $65 locked for 3 weeks, 4.5% APY | $0.16 |
| Total TFT | $4.46 |
Your position cost: 100 × $0.65 = $65.00 Your TFT: $4.46 TFT as percentage of position: 6.9%
Translation: You need a 6.9% edge — meaning you need to believe the true probability is at least 6.9 percentage points different from the market’s implied probability — just to break even. If the market says 65% and you think the probability is 70%, that’s only a 5% edge, which is less than your friction. This trade loses money in expectation, despite your correct analysis.
Worked Example 2: A Polymarket Trade
Same scenario — 100 “No” contracts on a similar market.
| Cost Layer | Calculation | Amount |
|---|---|---|
| Spread | $0.01 spread, use limit order to split | $0.50 |
| Platform fee | None explicit | $0.00 |
| Slippage | Small order, negligible | $0.00 |
| Funding | Already hold USDC, no conversion cost | $0.00 |
| Opportunity cost | $65 locked for 3 weeks, 4.5% APY | $0.16 |
| Total TFT | $0.66 |
TFT as percentage of position: 1.0%
The same trade that requires 6.9% edge on Kalshi only requires 1.0% edge on Polymarket. This is why platform selection directly impacts profitability — and why many strategies that are theoretically profitable only work on low-friction platforms.
TFT Ranges by Platform
| Platform | Typical TFT (as % of position) |
|---|---|
| Polymarket (limit order, existing USDC) | 0.5–2% |
| Kalshi (ACH funded, limit order) | 3–7% |
| ForecastEx (IBKR balance, yield-offset) | 2–4% |
| FanDuel Predicts | 3–6% |
| PredictIt (legacy) | 15–25%+ |
⚠️ Critical insight: If your strategy has an average edge of 5%, it can only be profitably executed on platforms with TFT below 5%. On PredictIt, a 5% edge is a guaranteed loser after fees. On Polymarket, a 5% edge is highly profitable. The strategy doesn’t change — the platform determines whether it works.
Cross-Platform Arbitrage: When Friction Kills “Free Money”
Cross-platform arbitrage — buying on one platform where a contract is cheap and selling on another where it’s expensive — sounds like free money. It’s not, because of friction.
The Math of Arbitrage
Scenario: “Will Bitcoin exceed $150,000 by December 31, 2026?”
- Polymarket “Yes” price: $0.32
- Kalshi “Yes” price: $0.38
The apparent opportunity: Buy “Yes” on Polymarket at $0.32, sell “Yes” on Kalshi at $0.38. Lock in $0.06 risk-free profit per contract.
The friction reality:
| Cost | Polymarket Side | Kalshi Side | Total |
|---|---|---|---|
| Spread cost | $0.01 | $0.02 | $0.03 |
| Platform fee | $0.00 | ~$0.01 | $0.01 |
| Funding | USDC already on-platform | USD already on Kalshi | $0.00 |
| Capital locked (both sides) | ~$0.001 | ~$0.001 | $0.002 |
| Total friction | $0.042 |
Net profit: $0.06 − $0.042 = $0.018 per contract
The “free money” of $0.06 drops to $0.018 after friction — a 70% reduction. And this assumes:
- You have capital already positioned on both platforms (no transfer costs)
- Both sides fill simultaneously (no leg risk)
- No slippage on either side
If any of those assumptions break, the profit can evaporate entirely — or turn into a loss.
💡 This is why professional arbitrageurs use tools like ArbBets, Eventarb, and Prediction Hunt — they calculate TFT across platforms automatically and only flag opportunities where the spread exceeds the full friction cost. See our reviews → Arbitrage Tools
How to Reduce Your Friction
You can’t eliminate trading costs, but you can systematically reduce them:
1. Use Limit Orders (Savings: 50–100% of spread cost)
This is the single highest-impact change. By placing limit orders inside the spread instead of crossing at the market price, you capture the spread rather than paying it. On a $0.04 spread, a well-placed limit order can save you $0.02–$0.04 per contract.
2. Trade High-Liquidity Markets (Savings: variable)
Major markets on Kalshi and Polymarket have natural spreads of $0.01–$0.02. Niche markets can have spreads of $0.10+. Trading where the liquidity is means paying less friction per trade.
3. Fund Efficiently (Savings: 1–2.5% on first deposit)
- Kalshi: Use ACH (free) instead of debit card (~1.5% fee)
- Polymarket: Transfer USDC from an exchange rather than buying via onramp (saves 1–2% conversion premium)
- ForecastEx: Use existing IBKR balance to avoid any deposit friction
4. Reduce Round-Trips (Savings: significant over time)
Every entry and exit costs you spread + fees. If your strategy involves frequent trading (buying and selling multiple times before resolution), each round trip adds friction. Higher-conviction, fewer-trades approaches are more friction-efficient.
5. Choose the Right Platform for Your Strategy
- High-frequency / small-edge strategies: Polymarket (near-zero fees)
- Infrequent, high-conviction trades: Kalshi or ForecastEx (slightly higher fees, offset by regulatory protections)
- Arbitrage: Requires pre-funded accounts on multiple platforms to avoid transfer delays and costs
6. Track Your Friction Relentlessly
Create a simple spreadsheet that logs every trade’s TFT. After 50 trades, you’ll know your average friction — and you’ll quickly spot where costs are eating your edge.
| Trade # | Market | Platform | Edge Estimate | TFT | Net Expected Value |
|---|---|---|---|---|---|
| 1 | Fed rate June | Kalshi | 8% | 5.2% | +2.8% ✅ |
| 2 | BTC > $150K | Polymarket | 4% | 1.1% | +2.9% ✅ |
| 3 | UK election | Polymarket | 3% | 1.5% | +1.5% ✅ |
| 4 | GDP Q2 | Kalshi | 5% | 6.8% | −1.8% ❌ |
Trade #4 looked profitable on analysis — but TFT exceeded the edge. Without tracking, you’d never know you were losing money on that type of trade.
What You Learned
In this module, you learned:
- Five layers of cost make up the true price of every trade: spread, platform fees, slippage, funding costs, and opportunity cost
- Total Friction Threshold (TFT) is the minimum edge needed to break even — and it varies dramatically by platform (0.5% on Polymarket vs. 15%+ on PredictIt)
- The same strategy can be profitable on one platform and unprofitable on another — platform selection is a strategic decision, not a convenience choice
- Cross-platform arbitrage sounds like free money but is heavily constrained by friction — real profits after costs are often 70%+ smaller than the apparent spread
- Six practical techniques reduce friction: limit orders, high-liquidity markets, efficient funding, fewer round-trips, right platform selection, and relentless tracking
What’s Next
Now that you understand how order books work, how resolution happens, and what every trade truly costs, the next module teaches you to read the signals embedded in market data — volume spikes, price velocity, whale movements, and news-to-price lags.
→ Module 2.4: Reading Market Signals
🎯 Try This Now: Pick your most recent prediction market trade (or a hypothetical one). Calculate the full TFT using the five-layer framework. What was the spread cost? The platform fee? Any slippage? What’s the opportunity cost of locked capital? Now compare: is your estimated analytical edge larger than the TFT? If it’s not, the trade was mathematically unprofitable regardless of outcome.
Predictionist School is a free educational resource from Predictionist.com. We may earn referral commissions from platforms we recommend — see our disclosure policy for details. This content is for educational purposes only and does not constitute financial advice.