
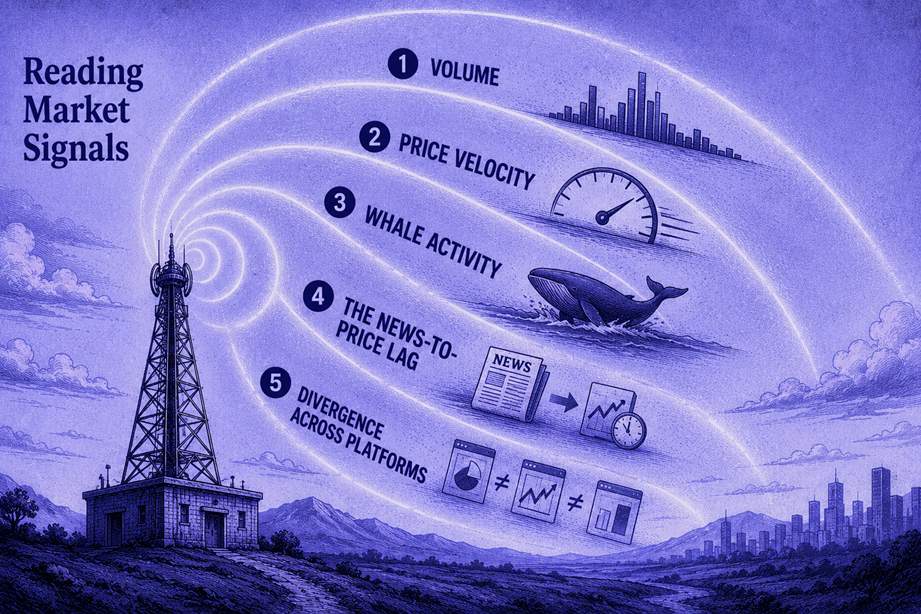
2.4 Reading Market Signals
Key Takeaways
- Price is only one signal — volume, velocity, whale activity, and news-to-price lag all contain tradeable information that most participants ignore
- A price at $0.60 with no volume means something very different from a price at $0.60 reached on $2 million in volume — volume validates price
- Whale tracking on Polymarket is possible because it’s on-chain — large wallet movements are public and often predictive
- The news-to-price lag (the delay between breaking news and the market reaching equilibrium) is where informed traders capture the most value — and it can last minutes, not seconds
- Not all signals are reliable — learning to distinguish information-driven moves from noise-driven moves is the core analytical skill of Level 2
Scope: This module teaches you to read market signals beyond price — the behavioral and structural data embedded in every prediction market. It builds on order book literacy from Module 2.1. It does not teach you how to build trading systems around these signals (that’s Level 3) or how to automate signal detection (that’s Module 3.3).
Signal 1: Volume
Volume is the number of contracts traded over a given period. It’s the most basic signal beyond price — and one of the most important.
What Volume Tells You
Volume validates price movements. A price increase on high volume is more meaningful than the same increase on low volume.
| Price Movement | Volume | Interpretation |
|---|---|---|
| Price rises $0.05 | High volume ($500K+) | Strong conviction behind the move. Many participants agree the probability has changed |
| Price rises $0.05 | Low volume ($5K) | Possibly a single trader or a thin book being pushed. The move may be fragile |
| Price flat | High volume | Active disagreement — lots of buying and selling. Something is happening beneath the surface |
| Price flat | Low volume | Dead market. No one cares or nothing is changing. Fine if you’re holding, but not a signal |
Volume Spikes
A volume spike — a sudden, large increase in trading volume relative to the market’s baseline — is the single most important volume signal. It almost always means one of two things:
New information has entered the market. A news event, data release, or rumor has changed participants’ probability estimates. The spike represents traders racing to update their positions.
A large player is entering or exiting. A whale is accumulating or liquidating a position, generating volume without necessarily reflecting new information about the event.
How to distinguish between the two:
- Check news feeds immediately. If there’s a corresponding headline, the spike is information-driven
- Check the price direction. If volume is high but price is stable, it might be a whale rotating positions (buying and selling equal amounts) or market makers rebalancing
- Check whether the volume is concentrated on one side. If 90% of the volume is buy-side, someone is aggressively accumulating
📍 Track volume in real time → Analytics Tools — platforms like PolyRadar and Jatevo provide volume alerts, historical volume charts, and breakdowns by order size.
Signal 2: Price Velocity
Price velocity measures how fast a price is moving — not just the direction, but the rate of change over time.
Why Velocity Matters
Two markets might both move from $0.50 to $0.65. But:
- Market A moved from $0.50 to $0.65 over 2 weeks, with gradual daily increments
- Market B moved from $0.50 to $0.65 in 45 minutes
These tell very different stories.
Gradual movement suggests a slow consensus shift. Participants are steadily updating their views as new information trickles in. The move is likely to be sticky — it’s not going to snap back.
Rapid movement suggests a shock — either breaking news or a large player’s aggressive entry. Rapid moves are more likely to overshoot in the short term. The market may move to $0.65, then retract to $0.58 as the initial panic/excitement wears off and more measured analysis sets in.
The Overshoot Pattern
Academic analysis of the 2024 U.S. presidential election on Polymarket documented this pattern clearly: after major political shocks (debates, significant political events), trading volume spiked instantaneously, but the price took several minutes to fully stabilize as traders disagreed about how the new information mapped to the actual probability (arXiv 2603.03152).
This overshoot-then-revert pattern is consistently exploitable:
- A shock event causes a rapid price movement
- The initial move overshoots (driven by emotional traders and momentum chasers)
- Over the next 5–30 minutes, the price partially reverts as analytical traders enter with more calibrated views
- The price settles at a new equilibrium between the old price and the overshoot peak
If you can identify the overshoot in real time, the reversion offers a trading opportunity. But this is much harder than it sounds — distinguishing an overshoot from a justified move requires strong analytical judgment, which is why we cover it in detail in Level 3.
Signal 3: Whale Activity
On-chain platforms like Polymarket offer a signal that traditional financial markets don’t: full transparency into who is trading and how much.
Every Polymarket trade is settled on the Polygon blockchain. Every wallet address, every transaction, and every position is publicly visible. This means you can track the behavior of large traders — “whales” — and use their activity as a signal.
What Whale Activity Looks Like
| Signal | What It Means | How to Interpret |
|---|---|---|
| Whale accumulates “Yes” over 3 days | Gradual, deliberate position building | Strong conviction. This isn’t a impulse trade — they’ve done analysis and are sizing in carefully |
| Whale dumps entire position in one block | Immediate, full exit | Either they’ve hit their profit target, or they’ve received information that changed their view |
| Multiple whales enter the same side simultaneously | Coordinated buying | Could indicate shared access to new information — or algorithmic traders reacting to the same signal |
| Whale enters opposite side of popular retail consensus | Contrarian positioning | These are often the most informed trades. When whales bet against retail, they’re usually right |
Why Whale Tracking Works
The data on whale profitability is stark: accounts trading over $500,000 on Polymarket achieve a +2.6% median ROI, while the overall retail population loses −8% (Citizens JMP Securities, 2026). Following what the profitable cohort does — not blindly, but as input to your own analysis — significantly improves signal quality.
The Limits of Whale Tracking
⚠️ Whale tracking is not a trading strategy by itself. It’s a signal — one input among many. Here’s why blind whale-following fails:
- You see the trade, but not the thesis. A whale might buy “Yes” at $0.40 as part of an arbitrage across three platforms. Following just the Polymarket leg without understanding the full position could lead you into a one-sided bet that the whale has hedged elsewhere
- Timing asymmetry. By the time you see a whale’s trade on-chain and react, the price may have already moved. The whale got $0.40; you might get $0.45
- Whales are wrong sometimes. Even the most profitable cohort has a median return of +2.6%, not +50%. They’re slightly less wrong than everyone else — not prescient
- Some “whales” are market makers. Market makers buy and sell continuously. Their transactions look like big trades but represent inventory management, not directional views
📍 Whale tracking tools → Analytics Tools — PolyMaster and PolyRadar provide wallet tagging, whale movement alerts, and historical wallet P&L tracking.
Signal 4: The News-to-Price Lag
This is the most actionable signal for informed traders. It’s the window between when news breaks and when the prediction market price fully incorporates that information.
How the Lag Works
In traditional stock markets, news hits prices in milliseconds — high-frequency trading algorithms parse headlines and execute trades at machine speed. Prediction markets are different:
- Lower automation. Most prediction market trades are still placed manually by human traders. Very few participants use algorithmic trading systems
- Information interpretation is harder. A jobs report number is easy to parse algorithmically. But “how does a debate performance change election odds?” requires human judgment
- Fragmented attention. Unlike stock traders who watch CNBC all day, prediction market participants are scattered across time zones, platforms, and attention levels. Many don’t see news for minutes or hours
The result: After major events, prediction markets exhibit a measurable lag — typically 2–15 minutes for well-covered events, and potentially hours for niche or international events — before the price reaches its new equilibrium.
Worked Example: An Economic Data Release
Event: The BLS releases the June 2026 jobs report at 8:30 AM ET. Unemployment comes in at 4.7% — significantly above the 4.4% consensus forecast.
Market: “Will the U.S. unemployment rate for June 2026 exceed 4.5%?”
Before the release: “Yes” = $0.35 (market expected unemployment around 4.4%)
Timeline after release:
| Time | “Yes” Price | What’s Happening |
|---|---|---|
| 8:30:00 | $0.35 | Report released. Most traders haven’t seen it yet |
| 8:30:15 | $0.42 | First fast-movers start buying. API scanners flag the number |
| 8:31:00 | $0.68 | Word spreads. Volume spikes. Market is repricing rapidly |
| 8:33:00 | $0.88 | Most active traders have now seen the data. Price approaching new equilibrium |
| 8:35:00 | $0.95 | Market largely stabilized. The remaining 5% gap reflects a tiny probability of data revision or reporting error |
| 8:40:00+ | $0.96 | Final equilibrium. Resolution is virtually certain |
The window: Traders who bought “Yes” at $0.42 one minute after the release could sell at $0.88 just two minutes later — a $0.46 profit per contract on a trade that required no prediction about the underlying event, just speed.
How to Exploit the Lag (Ethically)
- Set up news alerts for events tied to markets you’re tracking. Push notifications from Reuters, Bloomberg, or the official data source give you a head start over traders who are browsing Twitter
- Pre-analyze scenarios. Before a data release, determine: “If the number comes in above X, I’ll buy Yes. If below Y, I’ll buy No.” Having a decision framework ready eliminates analysis time when the moment arrives
- Use limit orders pre-positioned near your expected entry points. If you think unemployment above 4.5% will push “Yes” toward $0.90, place a limit buy at $0.45–$0.50 before the release. If the news triggers the move, your order might fill automatically in the chaos
- Practice first. Try this on small positions ($5–$10) to develop your speed and judgment before sizing up
⚠️ Important distinction: Exploiting the news-to-price lag using publicly available information is legal and ethical. Trading on material non-public information — such as front-running a government policy announcement you learned about through insider access — is a different matter entirely (see Module 1.4, Section: Insider Trading).
Signal 5: Divergence Across Platforms
When the same event is priced differently on different platforms, the gap itself is a signal.
What Divergence Tells You
| Divergence Type | Interpretation |
|---|---|
| Small divergence (1–3 cents) | Normal — reflects different fee structures, participant pools, and timing. Not usually tradeable after friction (see Module 2.3) |
| Large divergence (5+ cents) | Meaningful — indicates different information, participant biases, or structural factors. Potentially tradeable |
| Divergence growing over time | Platforms are disagree more, not less. Investigate why — one platform may have better information flow for this event type |
| Divergence narrowing | Convergence toward consensus. Often happens as resolution approaches |
Why Divergence Happens
- Different participant pools. Polymarket skews crypto-native and global; Kalshi skews U.S. finance. Their information sets and biases differ
- Different fee structures. Higher-fee platforms can sustain wider mispricings because arbitrageurs can’t profitably close the gap
- Different resolution criteria. Even for “the same” event, the exact resolution rules may differ across platforms, creating legitimately different probabilities
- Regulatory restrictions. U.S. users can’t trade on Polymarket; non-U.S. users can’t trade on Kalshi. Capital can’t flow freely between them, preventing arbitrage-driven price convergence
📍 Monitor cross-platform prices → Arbitrage Tools — ArbBets and Eventarb aggregate prices across platforms and alert you when divergences exceed configurable thresholds.
Putting Signals Together: A Framework
No single signal is reliable on its own. The power comes from combining multiple signals to build a more complete picture:
| Signal Combination | Interpretation | Conviction Level |
|---|---|---|
| Price up + High volume + Whale accumulation | Strong buying pressure with informed conviction | 🟢 High |
| Price up + Low volume + No whale activity | Fragile move, possibly thin-book artifact | 🟡 Low |
| Price up + High volume + Whale selling | Whales are distributing into retail buying. Possible top | 🔴 Caution |
| Volume spike + Price flat + Cross-platform divergence | Something is happening beneath the surface. Investigate before acting | 🟡 Medium |
| News event + Rapid price move + Overshoot pattern | Potential reversion opportunity. Wait for stabilization before entering | 🟡 Medium |
The best trades come from signal convergence — when multiple independent signals all point in the same direction. The worst trades come from acting on a single signal in isolation.
What You Learned
In this module, you learned:
- Five signal types provide tradeable information: volume, velocity, whale activity, news-to-price lag, and cross-platform divergence
- Volume validates price — high-volume moves are more meaningful than low-volume moves
- Rapid price movements tend to overshoot and partially revert — the overshoot window is exploitable by prepared traders
- Whale tracking is possible on Polymarket’s on-chain architecture and provides real informational value — but is not a standalone strategy
- The news-to-price lag is the most consistently exploitable signal for informed retail traders — and it lasts minutes, not seconds
- Combining multiple signals increases conviction; acting on single signals in isolation increases risk
What’s Next
The final module in Level 2 examines how the same event trades differently across platforms — and why those structural differences matter for your strategy, your risk, and your bottom line.
→ Module 2.5: Cross-Platform Differences
🎯 Try This Now: Set up a free alert system for one upcoming news event tied to a market you’re watching (e.g., a Fed announcement, a jobs report, a major political event). When the news breaks, immediately open the prediction market and observe: How fast does the price move? What does volume look like? Does the price overshoot and revert? Time the lag from news to price equilibrium. This real-time observation is worth more than any amount of theory.
Predictionist School is a free educational resource from Predictionist.com. We may earn referral commissions from platforms we recommend — see our disclosure policy for details. This content is for educational purposes only and does not constitute financial advice.