
3.4 Strategy: Systematic Bias Exploitation
Key Takeaways
- Prediction market crowds make systematic, documented errors — not random ones. These biases are persistent, measurable, and exploitable
- The favorite-longshot bias is the most well-documented: longshot outcomes (priced $0.05–$0.20) resolve “Yes” more often than prices imply, while heavy favorites ($0.85+) resolve “Yes” slightly less often
- Bias exploitation is a portfolio strategy, not a single-trade strategy — you need 20+ diversified positions to realize the statistical edge
- Knowing a bias exists ≠ profiting from it. You must combine bias awareness with proper sizing, discipline, and TFT management
- This strategy stacks analytical and structural edge — you’re exploiting both how people think wrong and how markets mechanically misprice
Scope: This module teaches you to identify and exploit systematic biases in prediction market pricing. It applies the analytical + structural edge framework from Module 3.1 and draws on calibration data referenced throughout Level 2. It does not cover cognitive biases in your own trading (that’s Module 4.4: Trading Psychology).
What Are Systematic Biases?
A systematic bias is a consistent, directional error made by market participants. Unlike random noise (which cancels out over many trades), systematic biases persist because they stem from deep-rooted psychological patterns, structural features of the market, or information processing shortcuts that humans reliably use incorrectly.
Random error: Sometimes the market overestimates; sometimes it underestimates. No pattern. Systematic bias: The market consistently overestimates in specific, identifiable situations. Pattern exploitable.
Bias 1: The Favorite-Longshot Bias
What It Is
The best-evidenced bias in probability markets. Originally documented in horse racing and sports betting, it appears consistently in prediction markets:
- Longshots (events priced at $0.05–$0.20) resolve “Yes” more often than their prices imply
- Heavy favorites (events priced at $0.85–$0.95) resolve “Yes” slightly less often than prices imply
In plain English: The crowd systematically overpays for favorites and underpays for longshots.
Why It Exists
Multiple psychological mechanisms drive this bias:
- Certainty preference. Traders gravitate toward “safe” bets near $0.90. Buying at $0.90 feels “almost guaranteed.” This demand inflates favorite prices above fair value
- Longshot neglect. A contract at $0.08 feels like “basically impossible.” Traders avoid or dismiss it without analysis. But 8% is not zero — one in twelve. Over many markets, those events happen, and underpriced longshots pay off
- Narrative bias. Favorites have compelling narratives (“of course this will happen”). Longshots don’t. Traders follow stories, not statistics
- Asymmetric attention. Favorites get more media coverage, more discussion, more social proof — all of which inflate confidence and price above the fundamental probability
Empirical Evidence
The favorite-longshot bias has been empirically confirmed in prediction market calibration studies. Polymarket calibration analyses show that:
- Events priced at $0.10 resolve to “Yes” at rates closer to 13–15% (30–50% underpriced)
- Events priced at $0.90 resolve to “Yes” at rates closer to 86–88% (2–4% overpriced)
The underpricing of longshots is much larger than the overpricing of favorites — meaning the biggest opportunity is on the longshot side.
How to Exploit It
The portfolio approach: You can’t exploit the favorite-longshot bias with a single trade — individual longshots lose most of the time (by definition). The strategy works across a diversified portfolio of longshot positions.
Example portfolio:
| Market | Market Price | Your Estimate | Position Cost | Outcome | P&L |
|---|---|---|---|---|---|
| Event A | $0.08 | $0.12 | $80 (1,000 contracts) | No | −$80 |
| Event B | $0.10 | $0.14 | $100 | No | −$100 |
| Event C | $0.07 | $0.11 | $70 | No | −$70 |
| Event D | $0.12 | $0.16 | $120 | Yes | +$880 |
| Event E | $0.09 | $0.13 | $90 | No | −$90 |
| Event F | $0.11 | $0.15 | $110 | No | −$110 |
| Event G | $0.08 | $0.12 | $80 | No | −$80 |
| Event H | $0.06 | $0.10 | $60 | Yes | +$940 |
| Total | $710 | +$1,290 |
Result: 6 out of 8 positions lost money. But the 2 winners more than compensated because each paid ~$1,000 on positions that cost $60–$120. Total portfolio return: +182%.
⚠️ The psychological challenge: You will watch most of your longshot positions expire worthless. Month after month, you’ll see −$80, −$100, −$70. Then one position pays +$940. You need the emotional discipline to endure a string of small losses while trusting that the math works over a large enough sample. This is genuinely hard — and why most traders who intellectually understand the bias can’t stick with the strategy long enough to realize the edge.
Bias 2: Recency Bias and Overreaction
What It Is
Traders systematically overweight recent events relative to base rates. If an unexpected political event just happened, markets overreact in the direction of the surprise — and then partially revert.
The Mechanism
- Shocking news breaks (unexpected debate performance, surprise resignation, economic shock)
- Traders rush to update their positions — but they overshoot because the emotional impact of the news dominates their probability estimate
- Over the next minutes to hours, more calibrated traders enter, and the price partially reverts
- The final price settles between the old price and the overshoot peak
We documented this pattern in Module 2.4 — the overshoot-and-revert dynamic was empirically verified in Polymarket data during the 2024 election cycle.
How to Exploit It
The contrarian entry: After a major news event causes a rapid price movement:
- Wait. Do not trade in the first 2–3 minutes unless you have a pre-analyzed scenario
- Identify the overshoot. If the price moved 15+ cents in under 10 minutes, it has likely overshot
- Estimate the revert level. Typically 30–50% of the initial move reverts
- Enter the contrarian position with a limit order at your expected revert level
- Set a tight stop. If you’re wrong and the move continues, exit quickly
Example:
- Pre-news price: $0.55
- Post-news spike: $0.75 (20-cent jump in 8 minutes)
- Expected revert: 30–50% of the move → price settles around $0.63–$0.67
- Trade: Buy “No” (or sell “Yes”) at $0.73, targeting exit at $0.66
- Profit per contract: $0.07 on a 1–3 hour hold
Risk: Sometimes the “overshoot” isn’t an overshoot — the market was simply too slow to price in genuinely transformative news. Getting this wrong means buying into a move that continues against you. This is why position sizing must be small relative to your portfolio.
Bias 3: The Status Quo Bias
What It Is
Markets systematically overprice the probability that the current situation will continue unchanged. “Will the incumbent win?” trades higher than base rates suggest. “Will the policy remain the same?” trades higher than historical change rates warrant.
Why It Exists
- Anchoring to the present. The current state is vivid and concrete; alternative states are abstract and uncertain. Traders anchor to what they can see
- Change requires imagination. Pricing in a change (a new government, a policy shift, a market disruption) requires modeling a counterfactual — something humans are systematically bad at
- Loss aversion. Trading against the status quo feels “risky” even when the base rate supports change. Traders avoid positions that make them feel uncomfortable
How to Exploit It
Look for markets where:
- The implied probability of “no change” or “incumbent wins” is significantly higher than the historical base rate for change in similar situations
- Multiple concrete precursors to change are already visible (polls narrowing, policy advisors quitting, economic conditions deteriorating)
- The market seems to be pricing in “everything will continue as it is” despite mounting evidence of instability
This is not a mechanical strategy — it requires judgment about which status quo assessments are biased and which are correctly priced. But the meta-pattern (markets overpricing continuity) is robust enough to serve as a screening filter.
Bias 4: The Certainty Premium
What It Is
Markets at $0.95–$0.97 that should be at $0.99+ represent a structural opportunity. Traders are reluctant to buy near $1.00 because the potential profit seems tiny — “why lock up $970 to make $30?”
Why It Exists
- Opportunity cost sensitivity. Locking capital for weeks to earn 3% feels unattractive — even though it annualizes to excellent returns
- Tail risk aversion. Even at $0.97, traders irrationally fear the 3% “what if it doesn’t happen?” scenario more than the math justifies
- Comparison to other trades. A $0.97 → $1.00 trade looks boring next to a $0.50 → $1.00 trade. Traders chase bigger payoffs even when the risk-adjusted return on near-certainties is superior
How to Exploit It
The near-certainty portfolio: Systematically buy contracts priced $0.95–$0.97 that you assess at $0.99+ probability.
Example returns:
| Entry Price | Resolution (Days) | Return per Contract | Annualized |
|---|---|---|---|
| $0.95 | 14 | 5.3% | 138% |
| $0.96 | 21 | 4.2% | 73% |
| $0.97 | 7 | 3.1% | 162% |
| $0.97 | 30 | 3.1% | 38% |
These returns look unexciting per-trade but are excellent on an annualized basis — especially given the near-zero risk. The key is selecting events that are genuinely near-certain, not just popularly assumed to be so. Events with predefined resolution sources and no ambiguity (Module 2.2) are ideal candidates.
Risk: The rare case where a near-certainty fails. At $0.97, a resolution to “No” costs you $0.97 per contract — wiping out 30+ successful trades. This is why even certainty-premium trades require portfolio-level risk management and should not consume more than 5% of your bankroll per individual position.
Building a Bias-Exploitation Portfolio
Bias exploitation works at the portfolio level, not the trade level. Here’s how to structure it:
Portfolio Construction Rules
- Minimum 20 positions across different biases and market categories. Below 20, variance is too high for the edge to reliably emerge
- Maximum 5% of bankroll per position. Even with high-confidence bias identification, individual positions can and will lose
- Mix bias types. Don’t put 100% into longshots — include some certainty-premium and mean-reversion trades for diversification
- Stagger resolution dates. If all 20 positions resolve in the same week, you have a concentrated portfolio, not a diversified one
- Track everything. Log every trade with: bias type identified, entry price, your estimate, resolution, P&L. After 50+ trades, analyze which biases you’re successfully exploiting and which you’re not
Model Allocation
| Bias Type | Portfolio Allocation | Expected Win Rate | Expected Return Profile |
|---|---|---|---|
| Longshot underpricing | 30% | 15–25% | Low win rate, very high per-win profit |
| Recency overreaction | 20% | 55–65% | Higher win rate, moderate per-win profit |
| Status quo overpricing | 20% | 40–55% | Moderate win rate, moderate profit |
| Certainty premium | 30% | 93–98% | Very high win rate, small per-win profit |
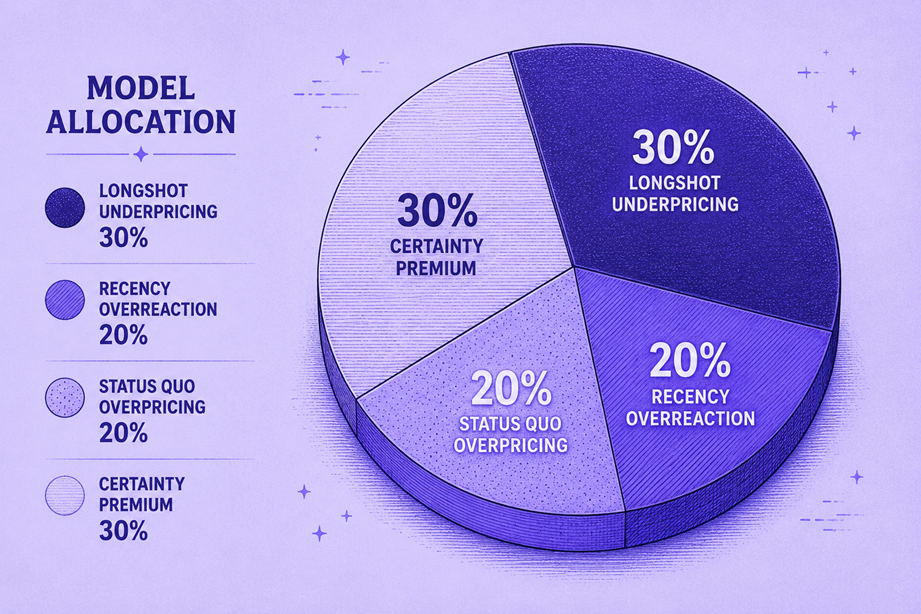
This blended approach smooths out the extreme variance of pure longshot portfolios while maintaining a strong aggregate edge.
What You Learned
In this module, you learned:
- Four documented biases create systematic mispricings: favorite-longshot, recency overreaction, status quo, and certainty premium
- Bias exploitation is a portfolio strategy — individual positions will frequently lose, but the aggregate edge is positive across sufficient trades
- The favorite-longshot bias is the largest and best-documented opportunity: longshots are consistently underpriced by 30–50%
- Recency overreaction creates short-term mean-reversion opportunities after major news events
- Portfolio construction rules (20+ positions, 5% max sizing, mixed bias types, staggered resolution) manage the high variance inherent in this approach
What’s Next
Biases are cognitive errors by the crowd. But some markets aren’t driven by crowd behavior at all — they’re determined by the decisions of individual actors. The next module teaches you to analyze single-actor markets: where one person’s decision (a president, a CEO, a regulator) determines the outcome.
→ Module 3.5: Fundamental Analysis — Single-Actor Markets
🎯 Try This Now: Browse Polymarket or Kalshi and find five markets priced between $0.05 and $0.15. For each one, look up the historical base rate for that type of event. Are any of them underpriced relative to the base rate? If you find one where your estimated probability is at least 50% higher than the market price, you’ve identified a potential favorite-longshot bias trade. Track all five for the next 30 days and record which ones resolve to “Yes.” This is your first calibration dataset for bias exploitation.
Predictionist School is a free educational resource from Predictionist.com. We may earn referral commissions from platforms we recommend — see our disclosure policy for details. This content is for educational purposes only and does not constitute financial advice.