
4.2 The Trading Journal
Key Takeaways
- A trading journal is your feedback loop — without it, you can’t distinguish luck from skill or identify what’s actually working
- Every trade must be logged with 10 required fields that capture your reasoning, execution, and outcome
- The journal’s real value comes from weekly and monthly reviews — patterns in your data reveal systematic strengths and weaknesses invisible in the moment
- Anti-retrofitting discipline means recording your thesis and probability estimate before you know the outcome — this prevents the unconscious revision of history
- Your Brier score — the gold-standard forecast accuracy metric — can only be calculated if you journal
Scope: This module teaches you to build and use a trading journal as a systematic performance feedback loop. It connects directly to the trading system from Module 4.1 and supports the portfolio analysis in Module 4.3.
Why Journal Every Trade
Most traders track their P&L. Few track their reasoning. This is like a doctor tracking patients who survive without recording what treatments were given — you can see outcomes but can’t learn from them.
The journal serves three purposes:
- Anti-retrofitting. Without a written record of why you entered a trade, your memory will unconsciously revise your reasoning to match the outcome. “I knew it was risky” after a loss. “I always liked that setup” after a win. Journaling locks your reasoning in place before the outcome is known
- Pattern recognition. After 50+ trades, your journal reveals patterns: which strategies are actually profitable, which market categories you overtrade, where your estimates are calibrated vs. biased, and what conditions precede your worst decisions
- Brier scoring. Your probability estimates, logged trade-by-trade, allow you to calculate your forecast accuracy using the Brier score — the only objective measure of whether you’re better than the market
The 10 Required Fields
Every trade entry must include:
| # | Field | What to Record | Why |
|---|---|---|---|
| 1 | Date & Time | Entry timestamp | Timing analysis; correlation with news events |
| 2 | Market | Full market name and platform | Categorization and platform performance comparison |
| 3 | Direction | Buy Yes / Buy No / Sell (if exiting) | Strategy tracking |
| 4 | Entry Price | Your actual fill price (not the target) | Slippage analysis |
| 5 | Position Size | Number of contracts and dollar amount | Sizing discipline verification |
| 6 | Your Probability Estimate | Your pre-trade estimate (e.g., 63%) | Calibration and Brier scoring |
| 7 | Edge Source | Informational / Analytical / Structural | Strategy attribution |
| 8 | Thesis (2–3 sentences) | Why you believe the market is mispriced | Anti-retrofitting; forces clarity |
| 9 | TFT | Calculated Total Friction Threshold | Friction awareness |
| 10 | Outcome & P&L | Final resolution, exit price, profit/loss | Performance tracking |
Optional but Valuable Fields
| Field | Purpose |
|---|---|
| Confidence level (1–5) | Track whether high-confidence trades outperform low-confidence ones |
| Emotional state | Were you calm, anxious, excited, revenge-trading? Correlate with outcomes |
| Post-trade notes | What you learned after resolution — but write this AFTER, not before |
| Screenshot of order book | Visual record of market conditions at entry |
The Brier Score: Measuring Your Accuracy
The Brier score is the mean squared error of your probability forecasts. It ranges from 0 (perfect) to 1 (worst possible).
How to Calculate
For each trade:
Brier score = (your estimate − actual outcome)²
Where actual outcome = 1 if the event happened, 0 if it didn’t.
Example across 5 trades:
| Trade | Your Estimate | Outcome | Brier Score |
|---|---|---|---|
| 1 | 0.70 | 1 (Yes) | (0.70 − 1)² = 0.09 |
| 2 | 0.30 | 0 (No) | (0.30 − 0)² = 0.09 |
| 3 | 0.80 | 1 (Yes) | (0.80 − 1)² = 0.04 |
| 4 | 0.55 | 0 (No) | (0.55 − 0)² = 0.30 |
| 5 | 0.40 | 1 (Yes) | (0.40 − 1)² = 0.36 |
| Average | 0.176 |
Interpreting Your Brier Score
| Brier Score | Interpretation |
|---|---|
| 0.00–0.10 | Excellent — superforecaster territory |
| 0.10–0.20 | Good — consistently better than chance |
| 0.20–0.25 | Average — roughly equivalent to naive forecasting |
| 0.25+ | Below average — your estimates are adding noise, not signal |
The key comparison: Calculate the Brier score for the market prices at the time you traded. If your Brier score is consistently lower (better) than the market’s, your estimates are adding value. If it’s higher, the market is more accurate than you are — and you should either improve your methodology or stop overriding market prices.
The Review Cycle
The journal is useless if you only write in it. The value comes from structured reviews.
Weekly Review (15 minutes, every Sunday)
- P&L summary: Total won/lost this week. Running balance
- System compliance: Did you follow all system rules? Any overrides?
- Standout trades: One best trade (why it worked) and one worst trade (why it didn’t)
- Emotional check: Any revenge trades, FOMO entries, or undisciplined exits?
Monthly Review (1 hour, end of each month)
- Brier score update: Recalculate across all trades with resolved outcomes
- Strategy attribution: Which edge sources generated profit? Which lost money?
- Category analysis: Which market categories are you best at? Worst at?
- TFT accuracy: Compare estimated TFT to actual friction experienced. Recalibrate if needed
- System adjustments: Based on data, should you modify any selection filters, sizing rules, or exit criteria?
Quarterly Review (2 hours, every 3 months)
- Full performance audit: Aggregate P&L, Brier score trend, win rate by strategy
- Edge decay assessment: Are your strategies becoming less profitable over time? If so, why?
- Comparison to market: Would a passive strategy (always agreeing with the market) have outperformed?
- System overhaul decision: Is the current system worth continuing, or does it need fundamental changes?
Journal Formats
Option 1: Spreadsheet (Recommended for Most Traders)
A Google Sheet or Excel workbook with:
- Sheet 1: Trade Log — the 10 required fields, one row per trade
- Sheet 2: Dashboard — auto-calculated P&L, Brier score, win rate, strategy breakdown
- Sheet 3: Review Notes — weekly/monthly/quarterly review entries
Option 2: Dedicated Trading Journal App
Several apps support trade journaling with built-in analytics, though few are optimized for prediction markets specifically. Adapt a general trading journal app by customizing fields.
Option 3: Markdown/Text File
For the minimalist. A structured text file per trade with the 10 fields. Less analytics automation but perfectly functional.
Our recommendation: Start with a spreadsheet. The auto-calculation of Brier scores and strategy breakdowns is worth the marginal setup effort over a text file. If the downloadable template is available, use it as a starting point.
Worked Example: A Complete Journal Entry
Here’s what a real journal entry looks like with all 10 fields:
| Field | Entry |
|---|---|
| Date & Time | 2026-04-15, 09:42 UTC |
| Market | “Will CPI for March 2026 exceed 3.5%?” — Kalshi |
| Direction | Buy Yes |
| Entry Price | $0.38 (limit order filled) |
| Position Size | 200 contracts × $0.38 = $76 (3.8% of $2,000 bankroll) |
| My Probability Estimate | 58% |
| Edge Source | Analytical — data-driven model using Cleveland Fed Nowcast + shelter inflation trend |
| Thesis | Cleveland Fed Nowcast shows 3.7% CPI estimate. Market is underpricing because the previous month came in at 3.3%, creating recency bias toward lower numbers. Shelter inflation remains sticky at 5.1% YoY, which the consensus is underweighting. |
| TFT | 1.8% (Kalshi: ~$0.014 spread + ~$0.004 slippage) |
| Outcome & P&L | Pending — CPI release April 10 |
Post-resolution update (added April 10):
| Field | Entry |
|---|---|
| Outcome | CPI came in at 3.6% — resolved YES |
| P&L | +$124 ($200 payout − $76 cost) |
| Post-trade notes | Thesis was correct — shelter inflation drove the beat. The Cleveland Fed Nowcast was within 0.1%. My estimate (58%) was slightly below the actual base rate for Nowcast beats (historically ~65% when Nowcast shows a clear directional signal). Should have estimated higher. Brier contribution: (0.58 − 1)² = 0.1764 — slightly worse than if I’d estimated 65%: (0.65 − 1)² = 0.1225. Lesson: trust the Nowcast signal more next time. |
This entry takes 90 seconds to write. The post-resolution update takes 3 minutes. The insight it generates — “trust the Nowcast more” — may be worth hundreds of dollars on the next CPI trade.
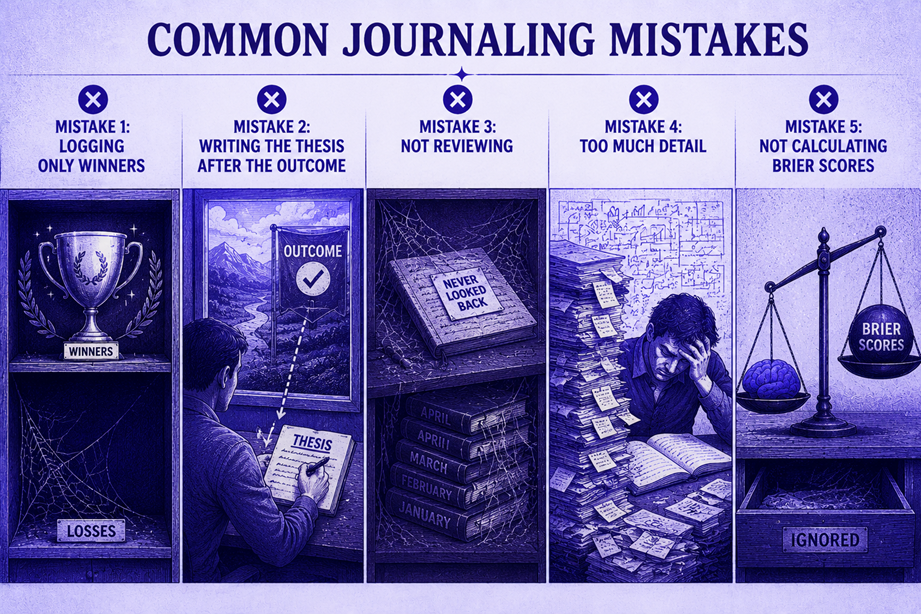
Common Journaling Mistakes
Mistake 1: Logging Only Winners
Some traders “forget” to log losing trades or log them with minimal detail. This creates survivorship bias in your own data — your journal shows you as more accurate and profitable than you actually are. Log every trade, especially the losses. Losses contain more learnable signal than wins.
Mistake 2: Writing the Thesis After the Outcome
If you write your thesis after you know the result, your brain will unconsciously construct a narrative that explains the outcome. This is useless for learning. The thesis must be written at entry, before resolution. If you forgot, leave the thesis field blank — an honest blank is better than a fabricated rationale.
Mistake 3: Not Reviewing
The most common failure mode: diligently logging every trade, building a beautiful spreadsheet with 100+ entries, and never analyzing it. The journal only generates value through the review cycle (weekly, monthly, quarterly). Schedule your reviews like meetings — put them in your calendar.
Mistake 4: Too Much Detail
Some traders write 500-word journal entries per trade. This creates entry fatigue, which leads to abandoned journals. Keep each entry to the 10 required fields plus 2–3 sentences of thesis. The discipline is consistency, not comprehensiveness.
Mistake 5: Not Calculating Brier Scores
Your journal is a dataset. If you’re not computing Brier scores at least monthly, you’re sitting on a gold mine without mining it. The Brier score is the only objective answer to the question: “Am I actually better than the market?”
The Journal as Competitive Weapon
After 6–12 months, your journal becomes your single greatest competitive advantage. Here’s why:
It Reveals Your Real Edge (or Lack Thereof)
Most traders believe they have edge. Your journal proves it. After 100+ trades with Brier scores, you know — not think, not hope, know — whether your estimates are better than the market’s. If they are, you scale up with confidence. If they aren’t, you stop bleeding money and fix the problem.
It Exposes Your Blind Spots
Common patterns that only emerge from journal analysis:
| Pattern | What It Reveals | Typical Fix |
|---|---|---|
| Your estimates on crypto markets have a 0.28 Brier score while your economics estimates are at 0.14 | You have genuine edge on economics but not crypto | Stop trading crypto. Focus on economics |
| Your win rate is 62% but your P&L is negative | You’re making money on many small trades and losing it on a few large ones — sizing problem | Review your sizing discipline. Are you oversizing on high-conviction trades that turn out to be wrong? |
| Your Monday morning trades perform 30% better than your Friday afternoon trades | Fatigue or end-of-week psychology is degrading your judgment | Don’t trade on Friday afternoons |
| Trades entered within 1 hour of a loss have 40% worse outcomes | You’re revenge trading | Enforce the 24-hour cool-down rule from Module 4.4 |
None of these patterns are visible without data. All of them are actionable. This is how professionals improve — not through more research, but through honest self-measurement.
What You Learned
- 10 required fields capture everything you need for systematic performance analysis
- The Brier score objectively measures your forecast accuracy — and lets you compare yourself to the market
- Weekly, monthly, and quarterly reviews transform raw trade data into actionable insights
- Anti-retrofitting (recording your thesis before the outcome) is the journal’s most important function — it prevents self-deception
- The journal is your feedback loop — without it, you’re flying blind
What’s Next
Your journal measures individual trade performance. The next module teaches you to think at the portfolio level — constructing a diversified set of positions that maximizes overall returns while managing correlation risk.
→ Module 4.3: Portfolio Construction
🎯 Try This Now: Create your trading journal right now. Open a spreadsheet, create 10 column headers matching the required fields, and log your most recent prediction market trade (or paper trade). If you don’t have one yet, find a market, form an estimate, and log the hypothetical entry. The hardest part is starting — once the template exists, logging each trade takes under 60 seconds.
Predictionist School is a free educational resource from Predictionist.com. We may earn referral commissions from platforms we recommend — see our disclosure policy for details. This content is for educational purposes only and does not constitute financial advice.