
3.1 Where the Edge Comes From
Key Takeaways
- Prediction markets are not fully efficient — they’re young, fragmented, populated by amateurs, and structurally imperfect. This is why edge exists
- Edge comes from exactly three sources: informational (you know something the market doesn’t), analytical (you process public information better), and structural (you exploit mechanical features of how markets work)
- Having edge means the odds favor you over many trades, not every trade — even with a genuine edge, you will lose individual trades regularly
- Survivorship bias is the biggest lie in prediction market education: you hear about winners, never about the hundreds who lost the same way
- The gap between “edge exists” and “I can capture it profitably after costs” is enormous — and most people never cross it
Scope: This is the philosophical anchor for all of Level 3. Every strategy module that follows (arbitrage, data-driven trading, bias exploitation, fundamental analysis, market making) is a specific application of one or more edge sources described here. Master this framework first — the strategies are implementations, not substitutes.
Part A: Why Prediction Markets Are Not Fully Efficient
The Efficient Market Hypothesis (EMH) — the idea that prices reflect all available information — is the dominant framework in traditional finance. If EMH fully applied to prediction markets, there would be no edge. Every price would be correct, and any attempt to beat the market would be pure luck.
EMH does not fully apply to prediction markets. Here’s why.
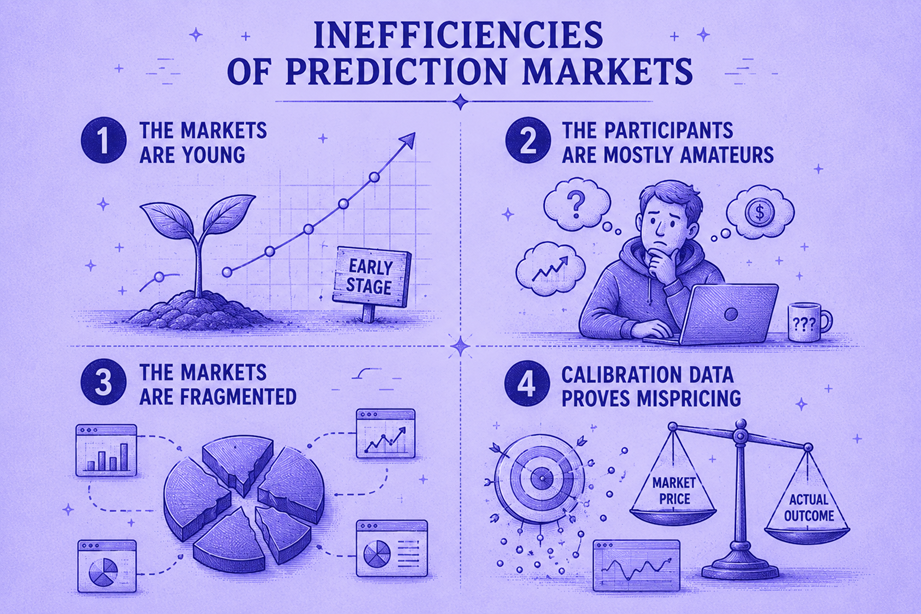
1. The Markets Are Young
The modern prediction market era — with meaningful volume, institutional participation, and real-money stakes — is approximately two years old (dating from Polymarket’s post-2024-election growth and Kalshi’s CFTC victory in late 2025). By comparison:
- The New York Stock Exchange has been operating since 1792 (234 years)
- The Chicago Mercantile Exchange has operated futures since 1898 (128 years)
- Modern electronic stock trading has existed since the 1990s (~30 years)
Financial markets spent decades developing the infrastructure, regulation, institutional participation, and analytical sophistication that makes them highly efficient. Prediction markets are at the beginning of this curve. The inefficiencies that existed in stock markets in the 1980s — information asymmetry, behavioral biases, thin liquidity — exist in prediction markets right now.
2. The Participants Are Mostly Amateurs
In the stock market, your counterparty is likely a algo-equipped hedge fund with a PhD quant team. In prediction markets, your counterparty is likely an individual with a smartphone who thinks they “just know” how politics works.
The data supports this:
- 70% of Polymarket users lose money (Citizens JMP Securities, 2026)
- Median retail return: −8%
- Small accounts (<$100) decay at −26.8% — worse than a casino
- 0.04% of wallets capture 70%+ of platform gains
This extreme concentration of profits means the vast majority of participants are systematically wrong. When your counterparties are consistently wrong, you have the opportunity to be consistently right — if you can identify how and why they’re wrong.
3. The Markets Are Fragmented
Capital doesn’t flow freely between prediction market platforms. As we covered in Module 2.5:
- Regulatory barriers prevent cross-border trading (U.S. users can’t access Polymarket; non-U.S. can’t access Kalshi)
- Currency barriers (fiat vs. USDC) create friction
- Different resolution mechanisms create genuine risk differentials
In traditional markets, fragmentation is rapidly eliminated by high-frequency arbitrage. In prediction markets, fragmentation persists — creating pricing discrepancies that can last days and span multiple percentage points.
4. Calibration Data Proves Mispricing
Academic and empirical analysis of prediction market calibration — how well prices correspond to actual outcomes — shows systematic biases:
The favorite-longshot bias: Events priced near $0.90+ resolve to “Yes” at approximately the rate you’d expect. But events priced in the $0.05–$0.20 range resolve to “Yes” more often than their prices imply. Longshots are consistently underpriced. This bias is well-documented in sports betting and has been empirically confirmed in Polymarket data.
The certainty premium: Markets tend to price “near-certain” outcomes at $0.95–$0.97 when the true probability is $0.99+. Traders are reluctant to buy at $0.97 because the potential profit ($0.03) seems small — but the risk-reward is often excellent (a 3% return over a short holding period annualizes to very attractive returns).
Recency bias: Prices overreact to recent events. After a dramatic news event, prices overshoot and then partially revert (as we documented in Module 2.4). This overshoot is a systematic mispricing that occurs repeatedly and predictably.
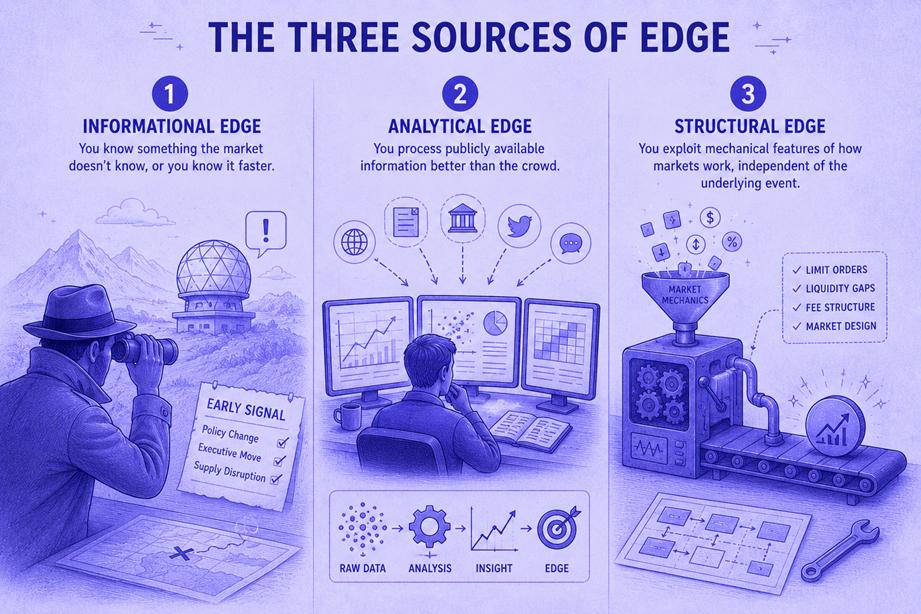
Part B: The Three Sources of Edge
Every profitable prediction market trade — every single one — relies on one or more of these three edge sources:
Edge Source 1: Informational Edge
Definition: You know something the market doesn’t know, or you know it faster.
This is the most intuitive form of edge: you have access to information that hasn’t been priced in yet.
Examples:
| Type | Scenario | Edge Mechanism |
|---|---|---|
| Speed | A jobs report releases at 8:30 AM. You have an alert system and are watching the market. Most traders learn the number 2–10 minutes later via social media | You trade within 30 seconds; the market takes 5 minutes to adjust. Your informational advantage is temporal |
| Depth | A local election in a small European country. You speak the language and follow local media. Most Polymarket traders are English-speaking and rely on CNN/BBC coverage | You understand local dynamics (coalition politics, regional turnout patterns) that international media misses |
| Domain expertise | You’re a meteorologist trading weather markets, or an economist trading GDP markets, or a game developer trading gaming industry markets | Your professional knowledge lets you assess probabilities more accurately than generalist traders |
The honest truth about informational edge: It’s the most powerful edge source, but it’s also the hardest to maintain. Once you act on information, your trades move the price — and other participants observe and follow. Informational edge decays the moment you use it.
Edge Source 2: Analytical Edge
Definition: You process publicly available information better than the crowd.
Everyone sees the same data. But not everyone interprets it equally well.
Examples:
| Type | Scenario | Edge Mechanism |
|---|---|---|
| Base rate thinking | The market asks “Will [politician X] survive this scandal?” and prices “Yes” at $0.45. You research: 82% of comparable politicians in similar scandals survived. The base rate says $0.82 is fairer | You correct for the crowd’s narrative bias with statistical reasoning |
| Model building | An inflation market is priced based on “vibes.” You build a simple model using the last 6 months of PPI data, supply chain indices, and wage growth to estimate CPI. Your model says $0.72; the market says $0.58 | Your quantitative framework is more rigorous than the crowd’s intuition |
| Decomposition | “Will Party X win the general election?” You break it into constituent probabilities: primary polling × turnout model × electoral college path × historical party-switching rates. The crowd treats it as a single emotional question | You decompose complexity into analyzable components while the crowd reacts to narratives |
The honest truth about analytical edge: This is the most teachable form of edge — which is why Level 3 modules focus heavily on it. But it requires genuine intellectual discipline. Many traders think they have analytical edge when they actually just have opinions. The difference is falsifiable methodology: if you can’t explain your probability estimate as a function of identifiable inputs, you don’t have analytical edge — you have a guess.
Edge Source 3: Structural Edge
Definition: You exploit mechanical features of how markets work, independent of the underlying event.
Structural edge doesn’t require better information or better analysis of the event itself. It requires understanding the platform mechanics and exploiting their quirks.
Examples:
| Type | Scenario | Edge Mechanism |
|---|---|---|
| Cross-platform arbitrage | “Yes” priced at $0.42 on Polymarket and $0.48 on Kalshi. After accounting for friction, a $0.02 risk-free profit exists per contract | You exploit fragmentation between platforms. The edge exists regardless of what happens with the event |
| The certainty premium | A market is at $0.96 with 2 days until certain resolution. Return: ~4% in 2 days (annualized: 730%) | You exploit other traders’ psychology of “not wanting to lock up capital for a 4% return” |
| Favorable-longshot exploitation | Systematic strategy of selling overpriced longshot “Yes” contracts across dozens of markets. Each position is small, but the aggregate portfolio benefits from calibration bias | You exploit a known, documented calibration error across a diversified portfolio |
| Market making | You provide liquidity on both sides of a market, earning the spread | You exploit the structural need for liquidity, profiting from the bid-ask gap regardless of outcome |
The honest truth about structural edge: It’s the most scalable and repeatable form of edge because it doesn’t depend on being smarter about any specific event. But it requires more capital (arbitrage needs funds on multiple platforms; market making requires significant inventory) and more sophistication (automation, fee management, risk calculation). Pure structural edge is where prediction markets start to feel like quantitative finance.
Part C: Edge Is Not a Guarantee
This section contains the most important truth in this entire curriculum. If you internalize nothing else from the Predictionist School, internalize this:
Having edge means you lose — regularly
A casino has a 2% house edge on roulette. This means:
- On any individual spin, the casino might lose $10,000 to a lucky bet
- Over 10,000 spins, the casino almost certainly profits
- The edge is only realized across a large number of trials
Your trading edge works the same way. If you have a 5% analytical edge — meaning you correctly identify mispricings that give you 5% more expected value than the market price — you will still lose individual trades regularly. A 5% edge doesn’t mean you win 55 out of 100 trades. It means the aggregate expected value across all trades is positive.
This has direct implications:
1. You need enough trades to realize your edge
A strategy that trades once per month cannot reliably demonstrate a 3% edge versus random chance. You need either high-frequency (many small trades) or high-conviction (fewer but larger edge trades) to accumulate enough data for your edge to overcome variance.
2. Bankroll management is the difference between strategy and gamble
If your edge is 5% but you bet your entire bankroll on each trade, you will eventually go broke — even with a genuine edge — because a streak of losses will wipe you out before the law of large numbers saves you.
This is why Module 1.4 introduced the 5% position sizing rule: never risk more than 5% of your bankroll on a single trade. For strategies with lower edge, the sizing should be even smaller. The Kelly Criterion (covered in Level 4) provides the mathematically optimal sizing.
3. Survivorship bias is everywhere
You hear about the trader who turned $500 into $50,000 on a presidential election bet. You never hear about the 200 traders who also bet $500 on their election picks and lost everything.
Every prediction market YouTube tutorial, every Twitter success story, every “how I made $X” blog post suffers from survivorship bias. The winners self-select into visibility. The losers go quietly.
Our data: 0.04% of Polymarket wallets captured 70%+ of gains. For every success story you see, there are approximately 2,500 losers you don’t see.
4. Edge erodes over time
As prediction markets mature, more participants become sophisticated, more capital enters, and pricing becomes more efficient. The edges that exist today — particularly structural edges like cross-platform arbitrage — will narrow or disappear as the industry develops.
This is not a reason to avoid trading. It’s a reason to capture edge now while it exists and to continuously improve your analytical and informational capabilities rather than relying on any single approach indefinitely.
The Edge Stacking Framework
The most consistently profitable traders don’t rely on a single edge source. They stack multiple edges on the same trade:
Example: A stacked trade on a Fed rate decision
| Edge Layer | Source | Contribution |
|---|---|---|
| Analytical | Your model, built on CPI trends + Fed dot plot + labor market data, estimates 72% probability of a hold. Market says 64% | +8% analytical edge |
| Structural | Polymarket’s lower friction (TFT ~1%) vs. Kalshi’s (TFT ~5%) | +4% cost advantage by trading on the right platform |
| Informational | You notice a Bloomberg article quoting an unnamed Fed governor as “more hawkish than expected” — which you interpret differently than the headline suggests | +2–3% from deeper reading of the same public source |
Stacked total edge: ~14% — far larger than any individual source.
You don’t need all three on every trade. But trades where multiple edge sources align are your highest-conviction opportunities — and should receive your largest position sizes (within the 5% rule).
What You Learned
In this module, you learned:
- Prediction markets are not fully efficient — youth, amateur participation, fragmentation, and documented calibration biases create persistent mispricings
- Edge has exactly three sources: informational (you know more or faster), analytical (you think better), and structural (you exploit market mechanics)
- Edge is probabilistic, not deterministic — having edge means winning over many trades, not every trade. Individual losses are expected
- Bankroll management converts edge into profit — without proper sizing, even genuine edge leads to ruin
- Survivorship bias is the most dangerous distortion in prediction market education — the winners you see represent 0.04% of participants
- Edge stacking — combining multiple edge sources on a single trade — creates the highest-conviction opportunities
What’s Next
Now that you understand why edge exists and where it comes from, the following modules teach you specific strategies for capturing it:
| Module | Edge Type | Focus |
|---|---|---|
| 3.2 Cross-Platform Arbitrage | Structural | Risk-free profit from price divergence |
| 3.3 Data-Driven Trading | Analytical | Model-based probability estimation |
| 3.4 Systematic Bias Exploitation | Analytical + Structural | Profiting from documented calibration errors |
| 3.5 Fundamental Analysis | Analytical + Informational | Single-actor markets and decision modeling |
| 3.6 Market Making | Structural | Providing liquidity for spread-based returns |
→ Module 3.2: Cross-Platform Arbitrage
🎯 Try This Now: Pick a market you’ve been following — one where you have an opinion about where the price “should” be. Now classify your opinion: Is it based on informational edge (you know something specific that the market doesn’t)? Analytical edge (you’ve processed public information more rigorously than the crowd)? Or is it just a gut feeling? If you can’t clearly identify which edge source supports your view, you probably don’t have one — and the trade is a gamble, not a strategy.
Predictionist School is a free educational resource from Predictionist.com. We may earn referral commissions from platforms we recommend — see our disclosure policy for details. This content is for educational purposes only and does not constitute financial advice.